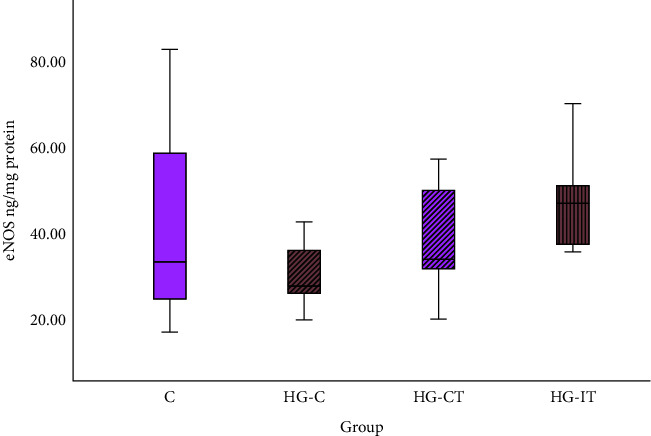
Figure 3.

eNOS concentration within each group. c: control group; HG-C: hyperglycemic control group; HG-CT : hyperglycemic rats that performed moderate-intensity continuous training (MICT); HG-IT: hyperglycemic rats that performed high-intensity interval training (HIIT). The error bars represent the standard deviation of measurements.
