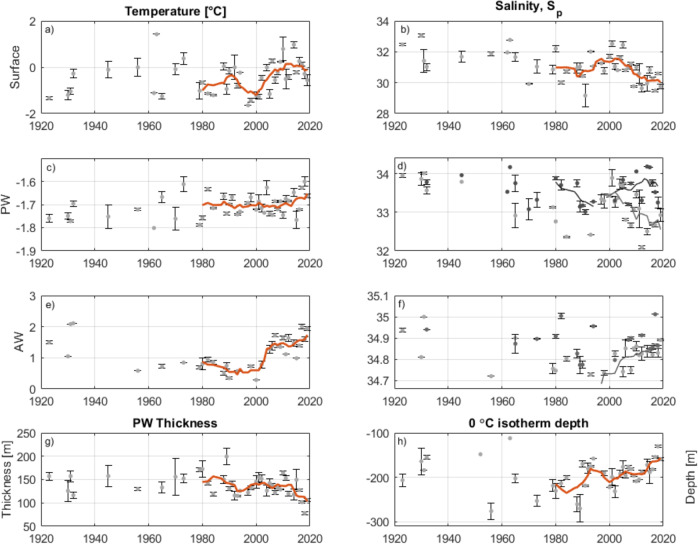
Fig. 4. Time series of summer (July/August/September) shelf water properties.
Surface water temperature (a) and salinity (b) defined as the mean of the 0–20 m depth interval, Polar Water (PW) core temperature (c), salinity (d), and layer thickness (g). Atlantic Water (AW) core temperature (e), salinity (f), and depth of the upper boundary of AW (h). In (d) PW and (f) AW core salinity is presented north (light gray) and south (black) of 73.5°N to show difference in trends. Division north and south of 73.5°N can be seen on supplementary Fig. 5 for all metrics. A 5-year running mean filter was applied to emphasize trends since 1980 (orange lines). Error bars indicate the standard error.

