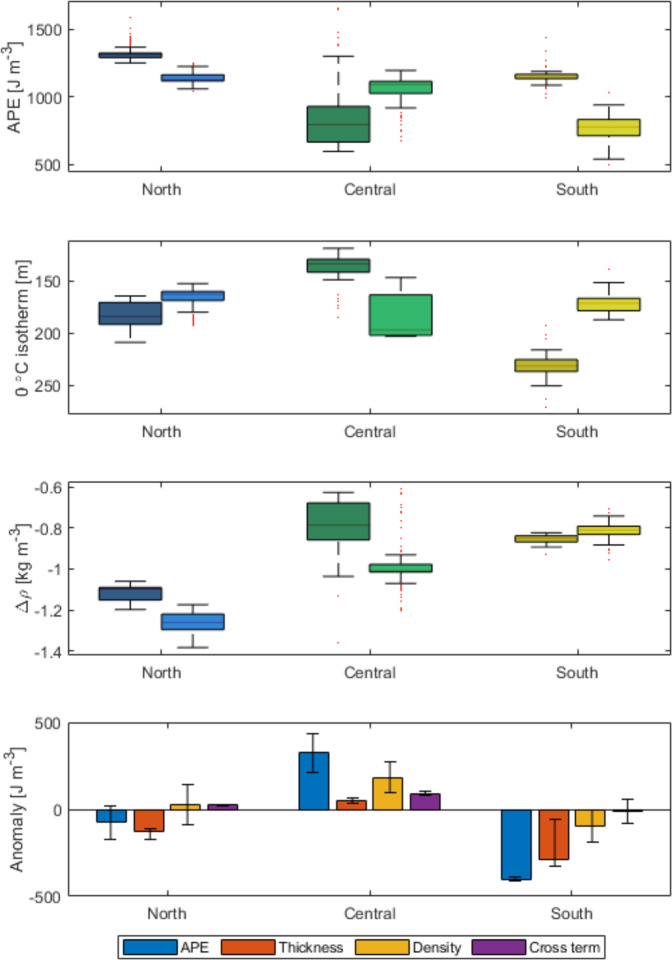
Fig. 5. Changes in Available Potential Energy and its constituents during July/August/September.
Available potential energy (APE, a), depth of the 0 °C isotherm (b) and mean density deviation (Δρ) from the surface to the depth of the 0 °C isotherm (c) in the north (81°N–77°N), central (77°N–74°N), and south (72°N–69°N) regions over the near-shore shelf. The dark and light colour shading give the 1980–2004 the 2004–2019 periods, respectively. Box plots indicate the median (middle line), 25th and 75th percentile (box) and the most extreme data points that are not outliers (box whiskers). The bottom panel shows the APE anomaly between the two periods and the thickness, density and cross-term contributions hereto (d). The error bars indicates one standard deviation.

