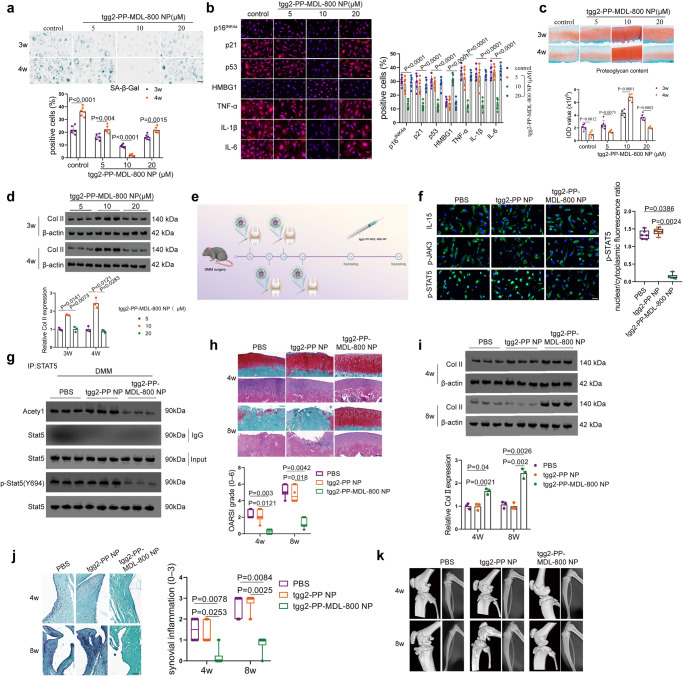
Fig. 7. tgg2-PP-MDL-800 NP attenuates chondrocyte senescence and OA progression.
a SA-β-Gal positivity was analyzed in human OA chondrocytes after 3 and 4 weeks of culture with tgg2-PP-MDL-800 NP or control (5, 10, or 20 µM). n = 6 independent biological replicates per group. b Representative immunofluorescent images of indicated markers in human OA chondrocytes after 4 weeks of culture with tgg2-PP-MDL-800 NP or control (5, 10, or 20 µM). n = 6 independent biological replicates per group. c Proteoglycan content was measured by safranin O-fast green staining in human OA cartilage explants after 3 and 4 weeks of incubation with tgg2-PP-MDL-800 NP. n = 6 independent biological replicates per group. d Western blot were performed to determine the Col II expression level at 3 and 4 weeks. n = 3 independent biological replicates per group. e Overview of the experimental set-up with injections of PBS, tgg2-PP NP or tgg2-PP-MDL-800 NP. f Representative immunofluorescent images of IL-15, p-JAK3, and p-STAT5 levels in these chondrocytes from different treatment groups. n = 6 independent biological replicates per group. g Western blot analysis of protein levels of Acetyl, p-Stat5 (Y694), and Stat5. n = 3 independent biological replicates per group. h, i At 4 and 8 weeks, Safranin O-fast green stained sections and H&E of cartilage (medial femoral condyle) showed that OA phenotype was significantly alleviated in OA mice model treated by tgg2-PP-MDL-800 NP, as evaluated by OARSI. n = 6 mice per group (h). A high level of Col II was observed in the tgg2-PP-MDL-800 NP treatment group. n = 3 independent biological replicates per group (i). j At 4 and 8 weeks, synovial inflammation was evaluated. n = 6 mice per group. k Representative micro-CT images of subchondral bone in the medial tibial plateau of PBS, tgg2-PP NP, or tgg2-PP-MDL-800 NP-treated DMM mice at 4w and 8w. n = 6 mice per group. Scar bar: c 200 μm, h, j (upper) 50 μm, a, b, j (lower) 20 μm, f 10 μm. Data were presented as the mean ± s.e.m (a–d, i) or median (25–75th percentiles) (f, h, j). P values are from two-tailed unpaired Student’s t-test (a, control and 10 μM groups in c), two-tailed unpaired t-test with Welch’s correction (5 and 20 μM groups in c), one-way ANOVA test followed by Tukey’s post hoc (b), two-way ANOVA test followed by Tukey’s post hoc (d, i), Kruskal–Wallis test followed by Dunn’s post hoc (f) or Scheirer–Ray–Hare test followed by Dunn’s post hoc (h, j). Source data are provided as a Source Data file.

