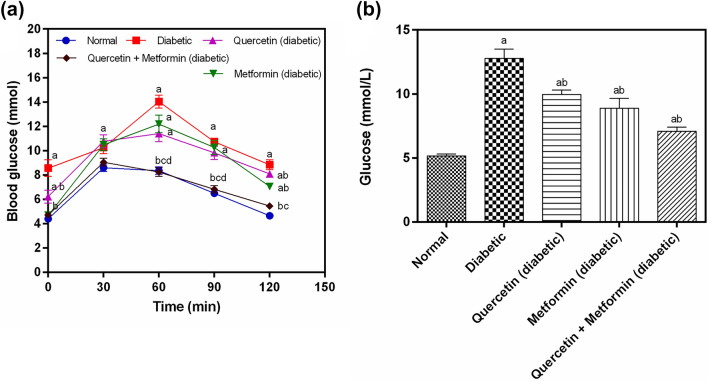
Figure 1.
Effect of test compounds on, (a) oral glucose tolerance test, (b) on plasma glucose in diabetic rats. Data represent mean ± SEM. The alphabet, ‘a’ shows a significant difference in comparison with normal control (p < 0.05). The alphabet, ‘b’ shows a significant difference in comparison to diabetic control (p < 0.05). The alphabet, ‘c’ shows a significant difference in comparison with a quercetin treatment group (p < 0.05). The alphabet, ‘d’ shows a significant difference in comparison with the metformin treatment group (p < 0.05).

