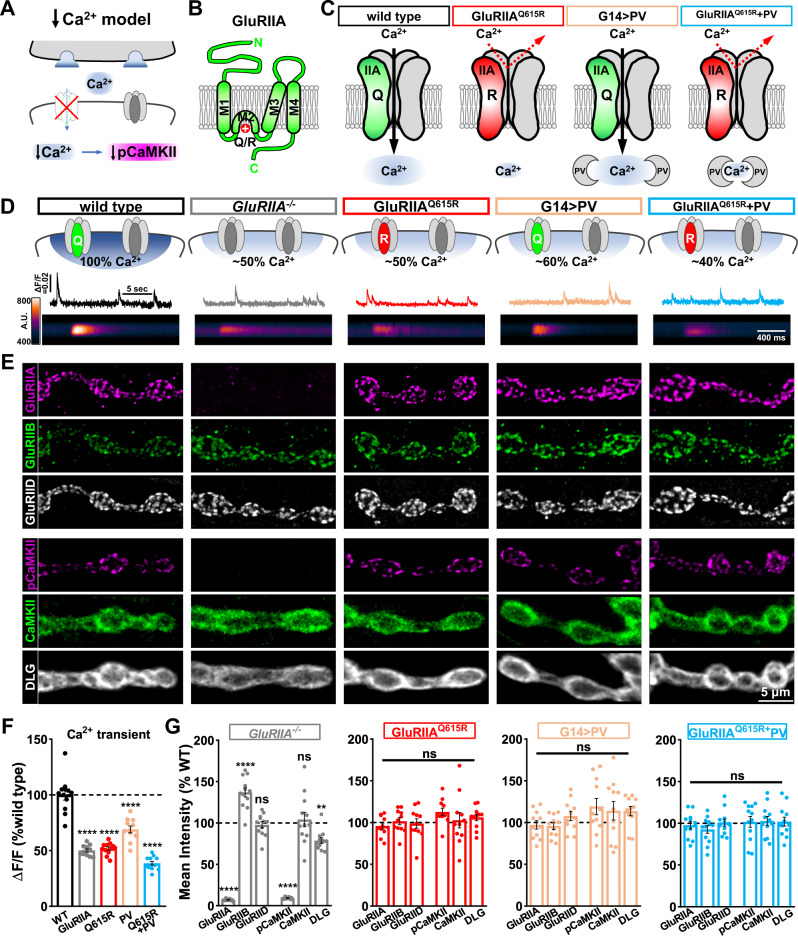
Fig. 2. pCaMKII levels are insensitive to reductions in postsynaptic Ca2+.
A Schematic illustrating that loss of GluRA receptors decreases postsynaptic Ca2+ influx and may reduce pCaMKII levels at postsynaptic compartments. B Membrane topology of the GluRIIA subunit with the Q615R mutation shown in the pore-forming M2 domain. C Schematics illustrating Ca2+ permeability through GluRA receptors and the Ca2+ buffer parvalbumin (PV), with the associated reductions in Ca2+ observed in postsynaptic compartments. Genotypes: GluRIIAQ615R (w;GluRIIAQ615R); G14 > PV (w;G14-GAL4/+;UAS-PV/+); GluRIIAQ615R + G14 > PV (w;GluRIIAQ615R,G14-GAL4/GluRIIAQ615R;UAS-PV/+). D Schematized GluRs and postsynaptic Ca2+ levels with representative Ca2+ imaging traces. Line scans below are derived from postsynaptic GCaMP6f images of individual spontaneous Ca2+ transients in the indicated genotypes: wild type (w;SynapGCaMP6f/+), GluRIIA−/− (w;GluRIIASP16;SynapGCaMP6f/+), GluRIIAQ615R (w;GluRIIAQ615R;SynapGCaMP6f/+), G14 > PV (w;G14-GAL4/+;UAS-PV/SynapGCaMP6f), GluRIIAQ615R + G14 > PV (w;GluRIIAQ615R,G14-GAL4/GluRIIAQ615R;UAS-PV/SynapGCaMP6f). E Representative images of NMJ boutons immunostained with anti-GluRIIA, -GluRIIB, -GluRIID, -pCaMKII, -CaMKII, and -DLG antibodies in the indicated genotypes shown in (D) without SynapGCaMP6f expression. Experiments were repeated four times independently with similar results. F Quantification of the normalized changes in fluorescence intensity (ΔF/F) of spontaneous Ca2+ transient events at individual boutons in the indicated genotypes in (D) (wild type: n = 12; GluRIIA−/−, n = 12, p < 0.0001; GluRQ615R: n = 12, p < 0.0001; G14 > PV: n = 11, p < 0.0001; GluRIIAQ615R + G14 > PV: n = 12, p < 0.0001). Repeated measures one-way ANOVA with Dunnett’s multiple comparisons test with a significance value of 0.05. p Value adjusted for multiple comparisons. G Quantification of the mean fluorescence intensity of anti-GluRIIA, -GluRIIB, -GluRIID, -pCaMKII, -CaMKII, and -DLG in the indicated genotypes normalized to wild-type values. (wild type: n = 18; GluRIIA−/−, n = 12, p < 0.0001 for GluRIIA, p < 0.0001 for GluRIIB, p = 0.9490 for GluRIID, p < 0.0001 for pCaMKII, p = 0.9848 for CaMKII, p = 0.0010 for DLG; GluRIIAQ615R: n = 12, p = 0.6473 for GluRIIA, p > 0.9999 for GluRIIB, p = 0.9889 for GluRIID, p = 0.3169 for pCaMKII, p = 0.9971 for CaMKII, p = 0.6843 for DLG; G14 > PV: n = 11, p = 0.8479 for GluRIIA, p = 0.7851 for GluRIIB, p = 0.6389 for GluRIID, p = 0.0547 for pCaMKII, p = 0.4991 for CaMKII, p = 0.0616 for DLG; GluRIIAQ615R + G14 > PV: n = 12, p = 0.8829 for GluRIIA, p = 0.4087 for GluRIIB, p > 0.9999 for GluRIID, p = 0.9980 for pCaMKII, p = 0.9965 for CaMKII, p = 0.9903 for DLG). Repeated measures One-way ANOVA with Dunnett’s multiple comparisons test with a significance value of 0.05. p Value adjusted for multiple comparisons. Error bars indicate ±SEM. Asterisks indicate statistical significance using One-way ANOVA: *p < 0.05, **p < 0.01, ****p < 0.0001; ns, not significant. n values indicate biologically independent NMJs. Absolute values for normalized data are summarized in Table S1. Source data are provided as a Source Data file.

