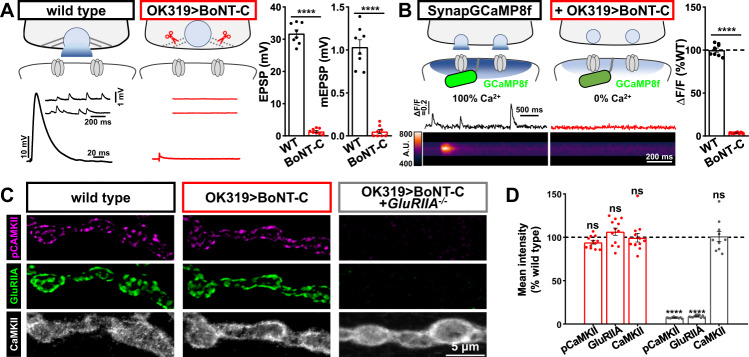
Fig. 3. CaMKII activity remains unchanged when synaptic transmission is silenced by BoNT-C.
A Schematic depicting cleavage of the synaptic vesicle SNARE complex by BONT-C expression (w;OK319-Gal4/+;UAS-BoNT-C/+), preventing all vesicle fusion. Representative electrophysiological traces and quantifications are shown for the indicated genotype, confirming no evoked or miniature transmission at NMJs silenced by BoNT-C. Quantification of average mEPSP amplitude (B), EPSP amplitude (C), and quantal content (D) values in the indicated genotypes (wild type: n = 8; OK319 > BoNT-C, n = 8, p < 0.0001 for mEPSP, p < 0.0001 for EPSP, unpaired, two-tailed t-test). B Schematic and postsynaptic Ca2+ imaging using a new SynapGCaMP8f indicator in wild type (w;SynapGCaMP8f/+) and BoNT-C silenced (+OK319 > BoNT-C: w;OK319-GAL4/+;SynapGCaMP8f/UAS-BoNT-C) NMJs. Quantification of transients, confirming no synaptic Ca2+ events in postsynaptic compartments following BoNT-C silencing. (wild type: n = 8; OK319 > BoNT-C, n = 8, p < 0.0001, unpaired, two-tailed t-test, with a significance value of 0.05). C Representative images of NMJs immunostained for pCaMKII, GluRIIA, and CaMKII in wild type, BoNT-C silenced, and GluRIIA mutants with BoNT-C silencing (w;OK319-GAL4,GluRIIASP16/GluRIIASP16;UAS-BoNT-C/+). Experiments were repeated three times independently with similar results. D Quantification of mean fluorescence intensity of the indicated antibodies (wild type: n = 12; OK319 > BoNT-C, n = 12, p = 0.1373 for pCaMKII, p = 0.3770 for GluRIIA, p = 0.9974 for CaMKII; OK319 > BoNT-C + GluRIIA−/−: n = 10, p < 0.0001 for pCaMKII, p < 0.0001 for GluRIIA, p = 0.9835 for CaMKII). Repeated measures one-way ANOVA with Dunnett’s multiple comparisons test with a significance value of 0.05. p Value adjusted for multiple comparisons. Note that pCaMKII levels are unchanged in BoNT-C silenced NMJs, while pCaMKII is abolished by loss of GluRIIA. Error bars indicate ±SEM. Asterisks indicate statistical significance using t-test or one-way ANOVA: ****p < 0.0001; ns, not significant. n values indicate biologically independent NMJs. Absolute values for normalized data are summarized in Table S1. Source data are provided as a Source Data file.

