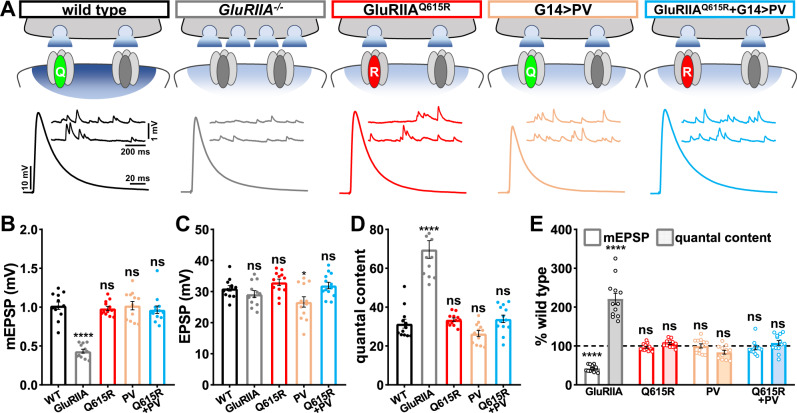
Fig. 4. Reductions in postsynaptic Ca2+ levels do not induce PHP expression.
A Schematic depicting genetic manipulations that reduce postsynaptic Ca2+ levels at the Drosophila NMJ. Representative electrophysiological traces are shown below each indicated genotype. B–D Quantification of average mEPSP amplitude (B), EPSP amplitude (C), and quantal content (D) values in the indicated genotypes in (A) (wild type: n = 12; GluRIIA−/−, n = 12, p < 0.0001 for mEPSP, p = 0.607 for EPSP, p < 0.0001 for QC; GluRQ615R: n = 12, p = 0.946 for mEPSP, p = 0.607 for EPSP, p = 0.942 for QC; G14 > PV: n = 12, p = 0.999 for mEPSP, p = 0.041 for EPSP, p = 0.437 for QC; GluRIIAQ615R + G14 > PV: n = 13, p = 0.812 for mEPSP, p = 0.942 for EPSP, p = 0.893 for QC). Repeated measures one-way ANOVA with Dunnett’s multiple comparisons test with a significance value of 0.05. p Value adjusted for multiple comparisons. E Quantification of mEPSP and quantal content values of the indicated genotypes normalized to wild-type values (wild type: n = 12; GluRIIA−/−, n = 12, p < 0.0001 for mEPSP, p < 0.0001 for QC; GluRQ615R: n = 12, p = 0.946 for mEPSP, p = 0.942 for QC; G14 > PV: n = 12, p = 0.999 for mEPSP, p = 0.437 for QC; GluRIIAQ615R + G14 > PV: n = 13, p = 0.812 for mEPSP, p = 0.893 for QC). Repeated measures One-way ANOVA with Dunnett’s multiple comparisons test with a significance value of 0.05. p Value adjusted for multiple comparisons. Error bars indicate ±SEM. Asterisks indicate statistical significance using one-way ANOVA: ****p < 0.0001; ns, not significant. n values indicate biologically independent NMJs. Absolute values for normalized data are summarized in Table S1. Source data are provided as a Source Data file.

