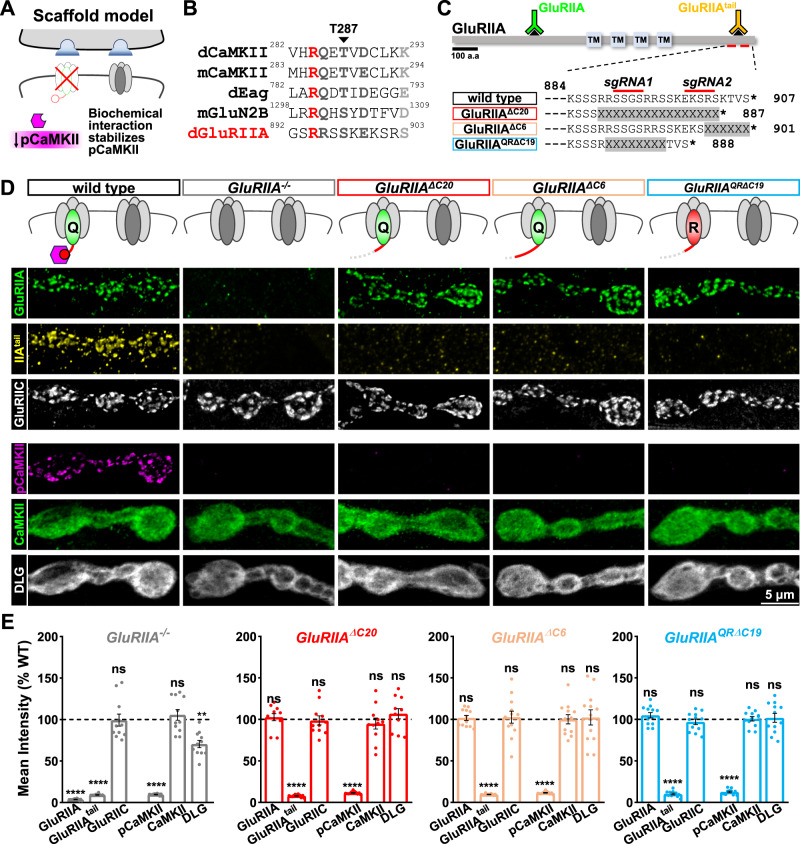
Fig. 5. Truncation of the GluRIIA C-tail abolishes active pCaMKII.
A Schematic illustrating the possibility that the GluRIIA C-tail stabilizes active pCaMKII at postsynaptic compartments. B Amino acid alignment of the mouse CaMKII autoinhibitory domain and homologous region in Drosophila, with the interaction sequences encoded in the C-tails of mouse GluN2B, Drosophila EAG, and the putative CaMKII interaction domain in the Drosophila GluRIIA C-tail. The black arrow indicates the Thr residue that is phosphorylated in active pCaMKII. The red Arg residue indicates the necessary R-X-X-S motif; dark gray indicates strongly conserved while light gray indicates weakly conserved residues. C Diagram of the GluRIIA C-tail amino acid sequence and three mutant truncation alleles of the C-tail induced by CRISPR mutagenesis. The regions of the two guide RNAs used to generate these alleles are shown, as well as the antigenic domains of two GluRIIA-specific antibodies. D Representative images of NMJ boutons immunostained with anti-GluRIIA, -GluRIIAtail, -GluRIIC, -pCaMKII, -CaMKII, and -DLG antibodies in the indicated genotypes: GluRIIAΔC20 (w;GluRIIAΔC20), GluRIIAΔC9 (w;GluRIIAΔC9), GluRIIAQRΔC19, and (w;GluRIIAQRΔC19). Experiments were repeated three times independently with similar results. Note that the loss of the terminal six amino acids of the GluRIIA C-tail is sufficient to completely lose pCaMKII signals. E Quantification of mean fluorescence intensities of the indicated antibody signal normalized to wild-type values (wild type: n = 12; GluRIIA−/−, n = 12, p < 0.0001 for GluRIIA, p < 0.0001 for GluRIIAtail, p = 0.9912 for GluRIIC, p < 0.0001 for pCaMKII, p = 0.9958 for CaMKII, p = 0.0022 for DLG; GluRIIAΔC20: n = 12, p = 0.1744 for GluRIIA, p < 0.0001 for GluRIIAtail, p = 0.9912 for GluRIIC, p < 0.0001 for pCaMKII, p = 0.9958 for CaMKII, p = 0.0022 for DLG; GluRIIAΔC6: n = 12, p = 0.6019 for GluRIIA, p < 0.0001 for GluRIIAtail, p = 0.9912 for GluRIIC, p < 0.0001 for pCaMKII, p = 0.9958 for CaMKII, p = 0.0022 for DLG; GluRIIAQRΔC19: n = 12, p = 0.9967 for GluRIIA, p < 0.0001 for GluRIIAtail, p = 0.9912 for GluRIIC, p < 0.0001 for pCaMKII, p = 0.9958 for CaMKII, p = 0.0022 for DLG). Error bars indicate ±SEM. *p < 0.05, ****p < 0.0001; ns, not significant. n values indicate biologically independent NMJs. Source data are provided as a Source Data file.

