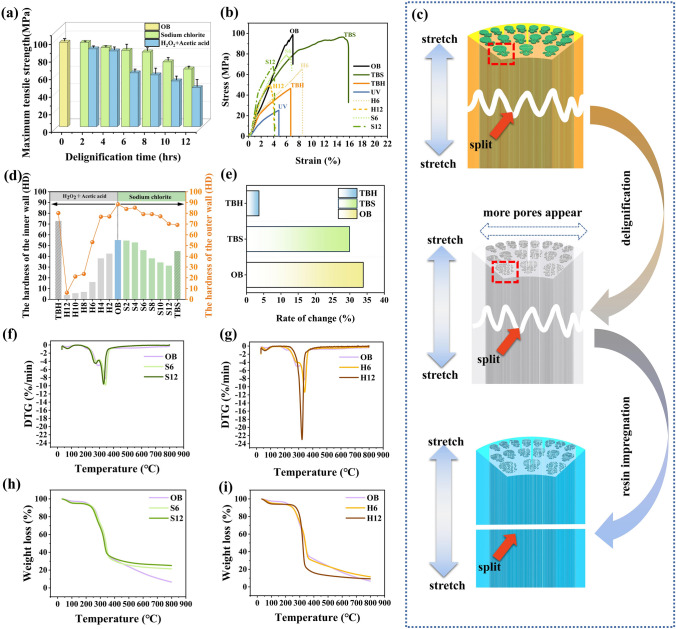
Fig. 5.
a Maximum tensile strength of OB and delignified bamboo. b Stress–strain curves of OB, TBS, TBH, UV, H6, H12, S6, and S12. c Schematic diagram of fracture of different samples when being stretched. d Surface hardness of the samples. e Mass change rate after water saturation of OB, TBS, and TBH. f DTG curves of OB, S6, and S12. g DTG curves of OB, H6, and H12. h TG curves of OB, S6, and S12. i TG curves of OB, H6, and H12

