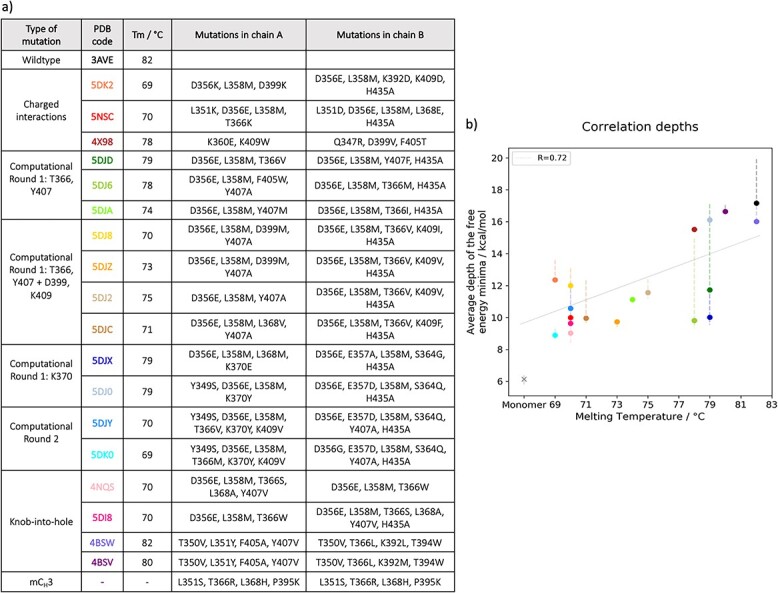
Fig. 1.

Correlation between depths of the free energy minima and melting temperatures. a) Table showing the PDB codes of the 20 systems with respective melting temperatures. Additionally, the point mutations that are present in each system are listed. b) The points, color coded according to the colors of the PDB colors in the table, represent the average depth of the free energy minima for each system. The error bars show the minimum and maximum of the average from the Leave-One-Out cross-validation. mCH3 is indicated by an ‘x’. No experimentally measured Tm is available for this variant; therefore, it is excluded from the correlation.
