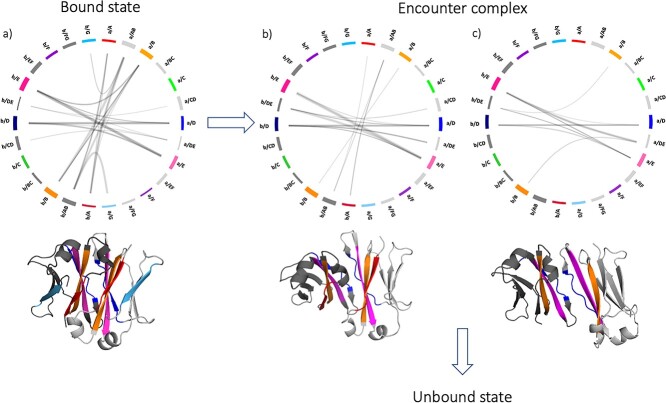
Fig. 4.
Mechanism of dissociation. The figure shows the change of the interface contacts during the dissociation process. The contacts between chain a and chain b are represented by flareplots in which the residues of the same secondary structure elements have been coarse grained. On the right side there are the elements of chain a, and on the left those of chain b. Next to each flareplot, a schematic representation of the structure in that point of dissociation is represented, in which the strands that make contacts are colored in accordance with the flareplot. The arrows indicate the different pathways in which the dissociation can progress.

