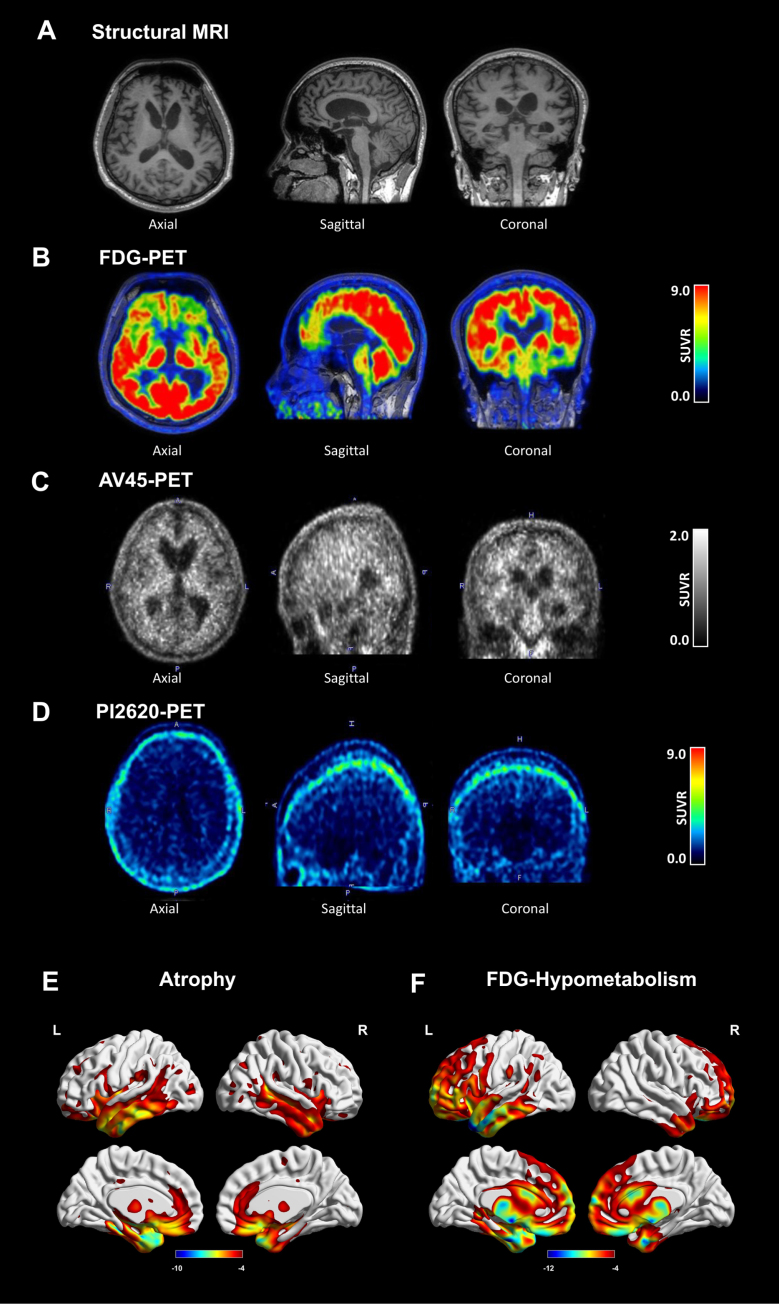
Fig. 2.
Neuroimages of the patient. Axial, sagittal, and coronal images of (A) structural MRI, (B) FDG-PET, (C) AV45-PET, and (D) PI2620 PET. (E) Atrophy and (F) Hypometabolism patterns in the patient in comparison with healthy controls. Detailed radiological Montreal Neurosciences Institution (MNI) coordinates of the clusters are shown in Table 1.

