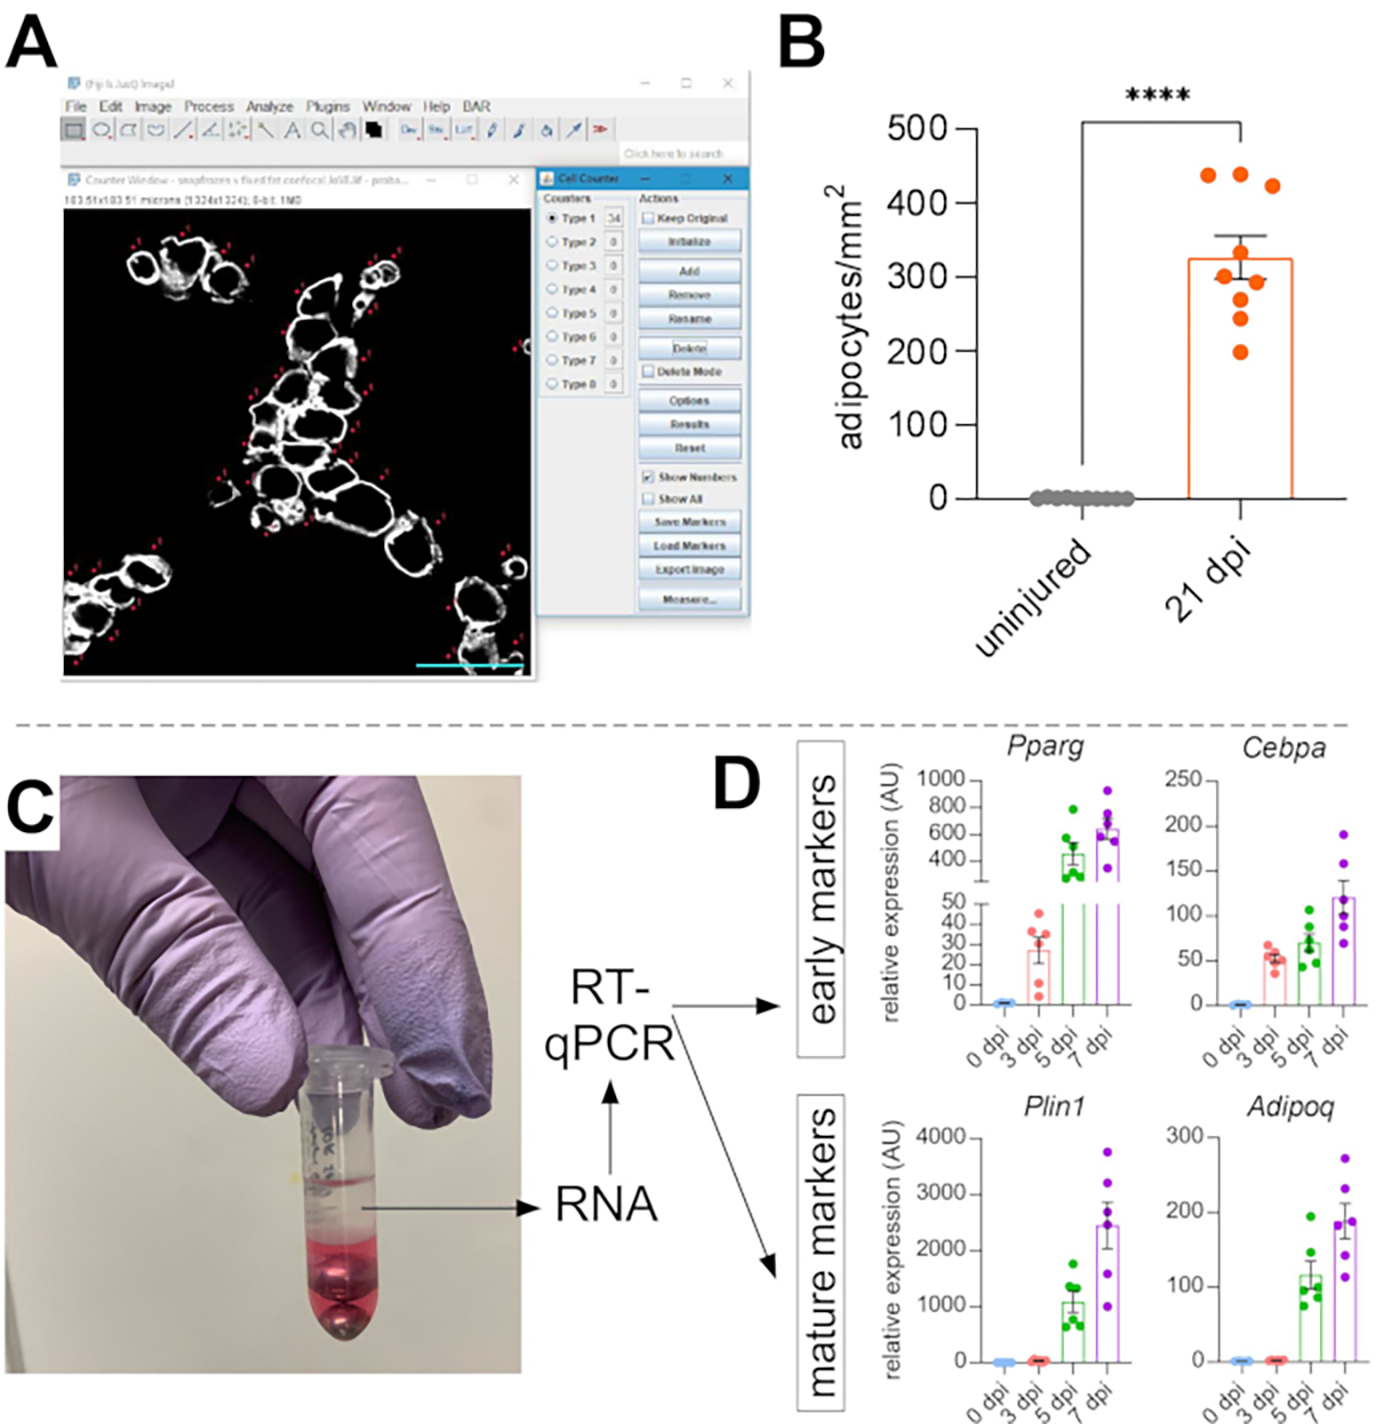
Figure 5: Quantifications of intramuscular fat.

(A) Representative image of how to count PERILIPIN+ adipocytes (white) using the Cell Counter function in ImageJ. Scale bar: 50 μm. (B) Whole TA adipocyte quantifications 21 days post glycerol injection normalized to 1 mm2 of the injured area. Each dot represents the average of one mouse. Error bars shown as SEM. **** = p < 0.0001. (C) RNA layer after homogenization and subsequent phase separation by chloroform is being used for RT-qPCR analysis. (D) Fold changes in expression levels of Pparg and Cepbα, early adipogenic genes, and Plin1 and Adipoq, two mature adipocyte markers, at different time points post glycerol injury. Each dot represents the average of one mouse. Error bars shown as SEM. Please click here to view a larger version of this figure.
