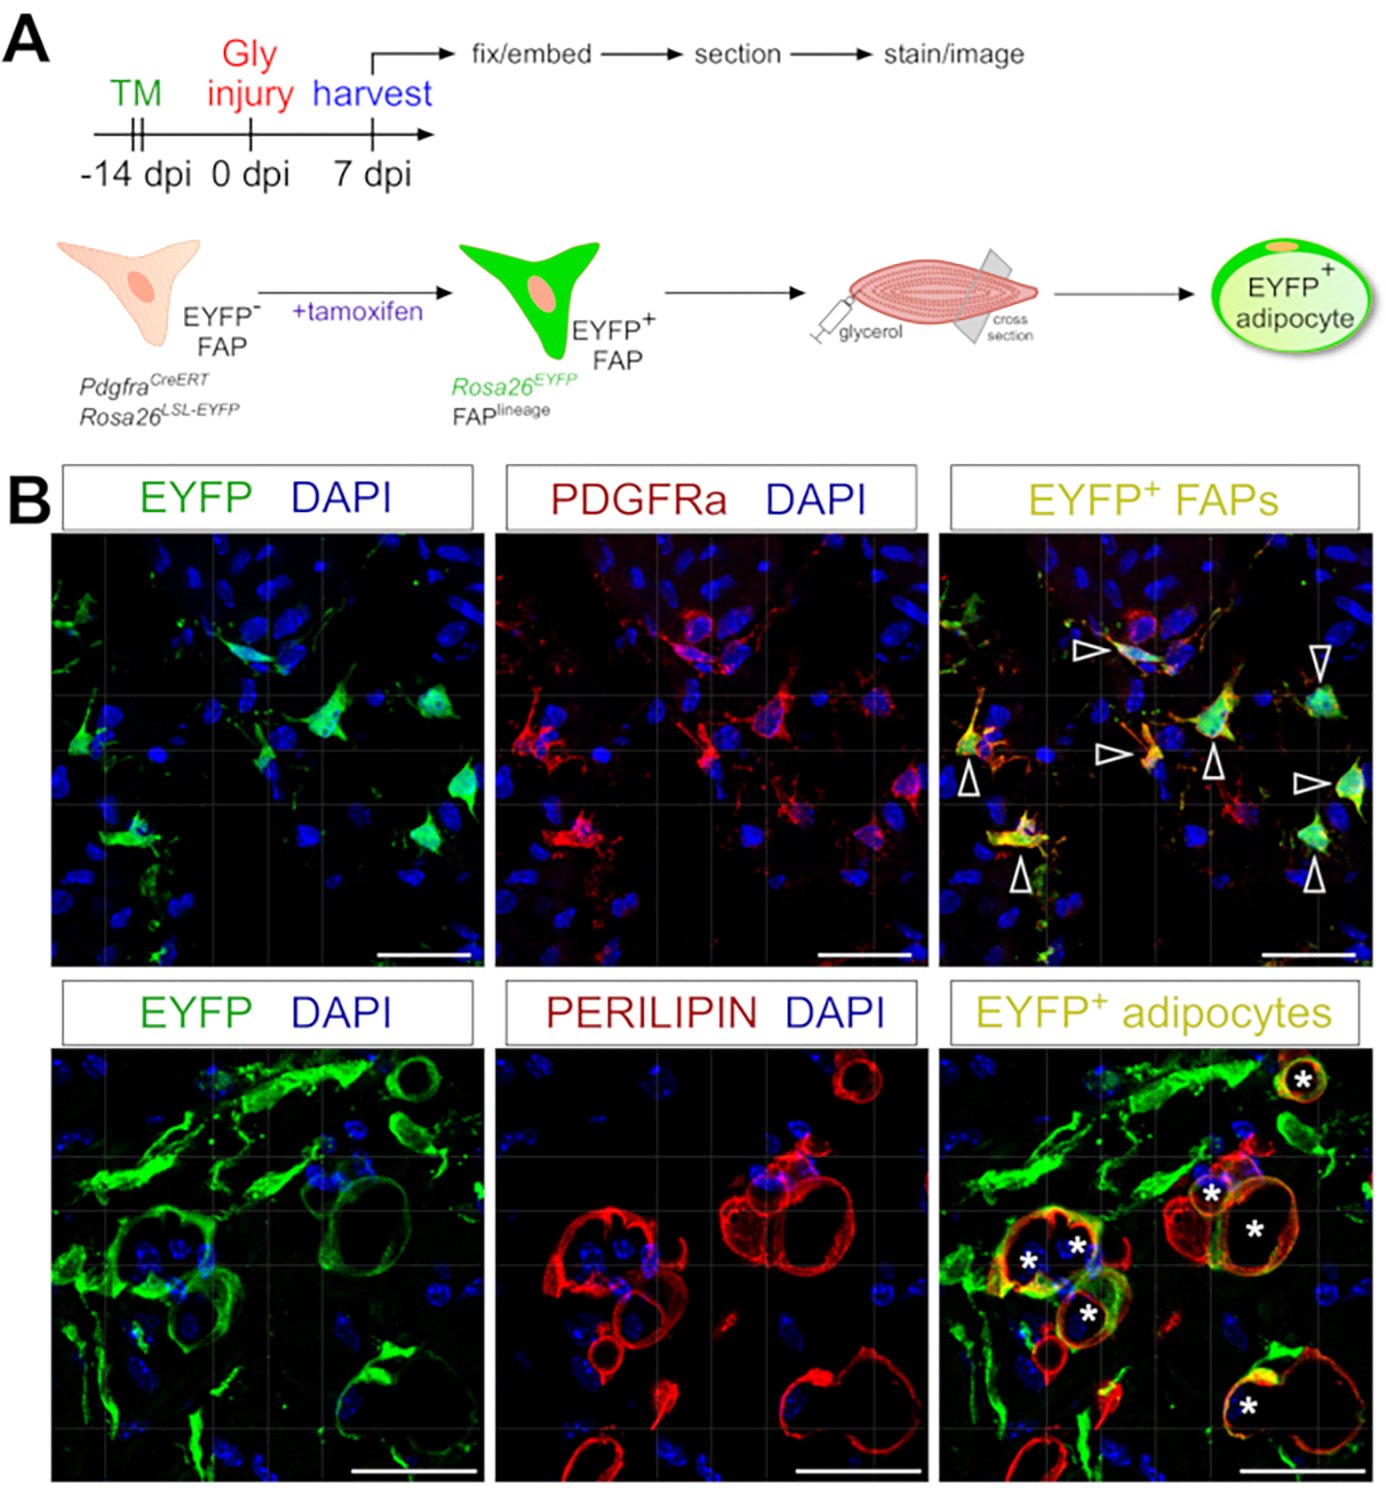
Figure 6: Lineage tracing of FAPs.

(A) Schematic overview of the experimental setup. (B) Representative immunofluorescent images showing successful recombination and activation of EYFP (yellow) within PDGFRα+ FAPs (red, arrowheads) and PERILIPIN+ adipocytes (red, asterisks). Scale bars: 25 μm. Please click here to view a larger version of this figure.
