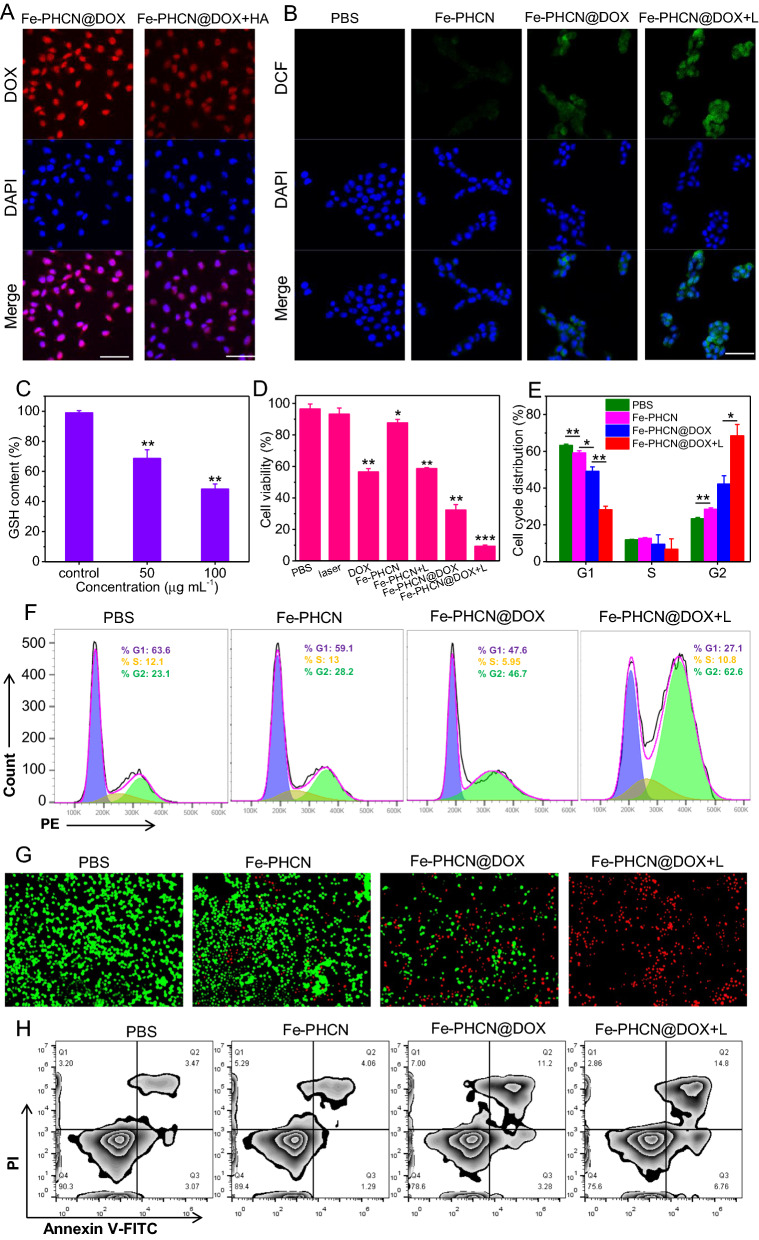
Fig. 4.
Cellular uptake and therapeutic efficacy of Fe-PHCN@DOX nano-nuclear-reactors. A Confocal images of the CT26 subcellular localization of the Fe-PHCN@DOX with/without HA treatment. The scale bar represents 50 μm. B Fluorescence images of DCF-stained CT26 cells under different group treatment. The scale bar represents 50 μm. C Intracellular GSH depletion under different concentrations of Fe-PHCN@DOX. D Cell survival rate after different group treatment by the CCK-8 assay. E, F Cell cycle arrest in G2 phase was measured under different group treatment. G Fluorescence images of calcein AM (green, live cells) and PI (red, dead cells) costained CT26 cells after different group treatment. The scale bar represents 100 μm. H Flow cytometry analysis of apoptosis in CT26 cells treated with different groups. The p values were analyzed using the Log-rank (Mantel-Cox) test. Data are presented as the mean ± standard error of the mean. *p < 0.05, **p < 0.01, ***p < 0.001

