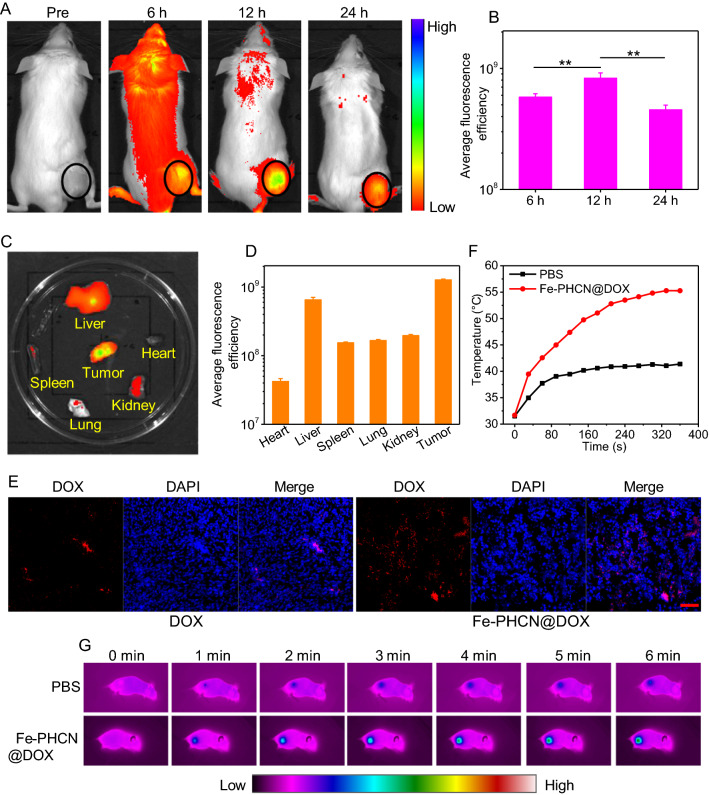
Fig. 6.
In vivo biodistribution and tumor microenvironment alterations by nano-nuclear-reactors. A In vivo fluorescence imaging of CT26 tumor-bearing mice intravenously injected with Fe-PHCN@DOX/Ce6 recorded under different time points. B The mean fluorescence intensity at the tumor sites was quantified using CRi maestro in vivo imaging system. Ex vivo fluorescence images (C) and the mean fluorescence intensity (D) of major organs and tumor dissected from mice injected with Fe-PHCN@DOX/Ce6. E The fluorescent signal of free DOX and Fe-PHCN@DOX in tumor tissues was recorded using confocal microscopy. The scale bar represents 50 μm. Temperature elevation curves (F) and infrared photothermal images (G) of tumor-bearing mice measured after intravenous injection of PBS and Fe-PHCN@DOX plus laser irradiation for 6 min. The p values were analyzed using the Log-rank (Mantel-Cox) test. Data are presented as the mean ± standard error of the mean. *p < 0.05, **p < 0.01, ***p < 0.001

