
Fig. 2. Recruitment of Tim-3 to the immune synapse of Jurkat and P14 Tg T cells.
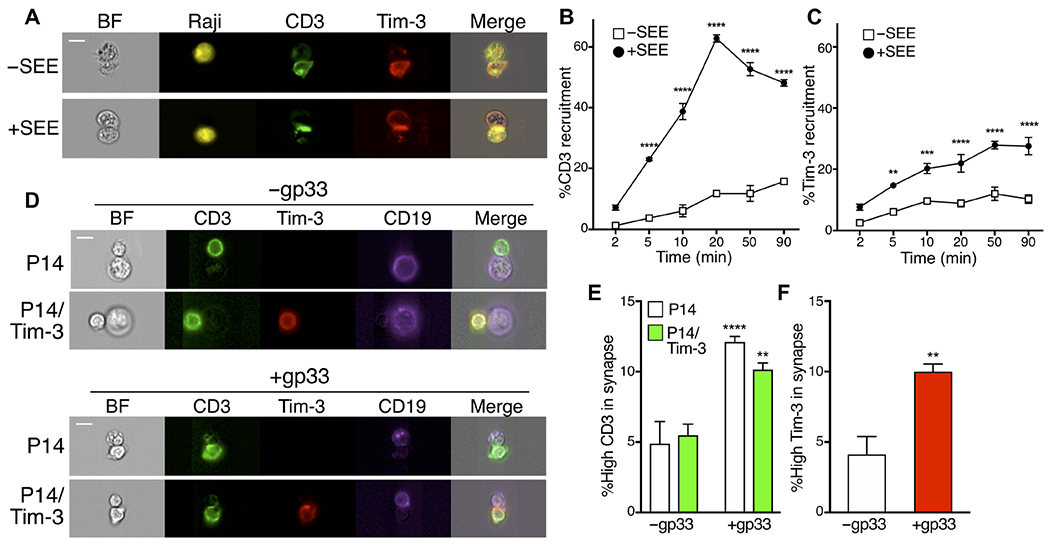
(A) Jurkat cells transfected with plasmid encoding Flag-tagged Tim-3 (red) were mixed with Raji cells (yellow) that were either unpulsed or pulsed with SEE at a ratio of 1:1 for 20 min and then were analyzed by ImageStream. BF, brightfield. (B and C) Cell-cell conjugates were incubated for the indicated times. The percentage of either CD3 or Tim-3 recruitment was quantified from the ratio of the intensity of either CD3 (green) or Tim-3 (red) within the interface mask of cell conjugates containing one Jurkat cell and a Raji cell to that of the whole cell mask, using IDEAS software. Each point represents an average of 291 conjugates. (D to F) CD8+ T cells from control P14 TCR Tg mice or those expressing Cre-inducible Tim-3 were mixed with purified B cells from the same mice, with or without gp33 peptide, and cell conjugates were analyzed as described for (B) and (C). Each bar represents an average of 418 cell conjugates in the absence of antigen and 5500 cells in the presence of antigen. Scale bars, 10 μm. Data in (A) to (C) are representative of two experiments, whereas data in (D) to (F) are representative of four experiments. **P < 0.01, ***P < 0.001, and ****P < 0.0001 by Tukey’s multiple comparisons test (B, C, and E) or Student’s t test (F).