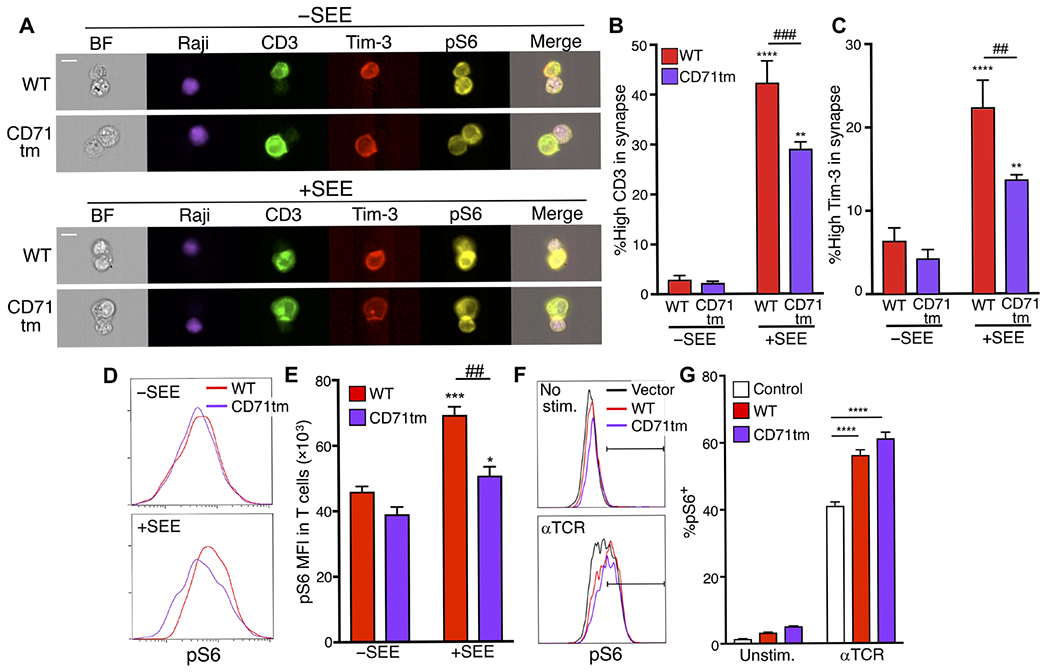
Fig. 4. Role of the TM domain in Tim-3 localization and function during immune synapse formation.

(A) Representative images of pS6 (yellow) in Jurkat cells transfected with plasmids encoding either Flag-tagged WT or CD71tm Tim-3 (red) and mixed with Raji cells (purple), which were either unpulsed of pulsed with SEE, at a ratio of 1:1, for 20 min. (B and C) Quantification of the percentage of CD3 (B) and Tim-3 (C) enriched in the immune synapses of multiple Jurkat cell–Raji cell conjugates in the presence or absence of SEE. Each bar represents 85 cell conjugates without SEE and 203 cell conjugates with SEE. (D) Representative histogram analyzing pS6 intensity in transfected Jurkat cells in cell conjugates with Raji cells in the presence or absence of SEE. (E) Quantification of the mean fluorescence intensity (MFI) of pS6 across multiple cell conjugates. (F) Flow cytometry analysis of pS6 within control, WT Tim-3-, or Tim-3 CD71tm–expressing transfected Jurkat cells stimulated with anti-TCR for 30 min. (G) Quantification of the percentage of pS6+ cells from the experiments shown in (F). Each panel is representative of at least two independent experiments. Data are means ± SEM. *P < 0.05, ***P < 0.001, and ****P < 0.0001 versus −SEE; ##P < 0.01 and ###P < 0.001 by Tukey’s multiple comparisons test. Scale bars, 10 μm. Data in (A) to (C) are representative of three experiments, whereas data in (D) to (G) are representative of two experiments.
