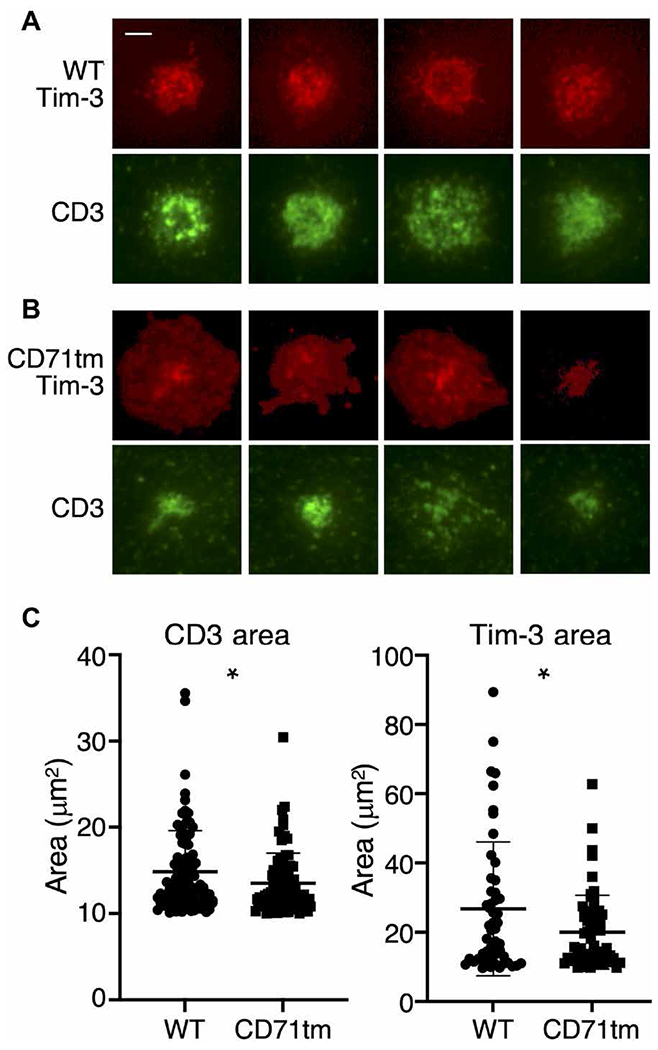
Fig. 5. Lipid bilayer imaging of immune synapses with WT versus CD71tm Tim-3.

(A and B) Representative images of murine CD8+ T cells expressing FAP-tagged WT Tim-3 (A) or CD71tm Tim-3 (B). Tim-3 localization was determined on the basis of FAP staining after the addition of dye. TCR/CD3 localization was tracked by a labeled anti-TCR (H57) Fab fragment (green). Images were acquired at 15 min after the addition of the T cells to the bilayer. Scale bar, 2 μm. (C) Quantitation of the average diameters of immune synapse c-SMACs containing Tim-3 and CD3 from 50 to 60 cells (Tim-3) or 80 to 90 cells (CD3). Statistical significance was derived from Student’s t tests of WT versus CD71tm. *P < 0.05. Data are representative of three experiments.
