
Figure 3. Lung Function and Symptom Scores.
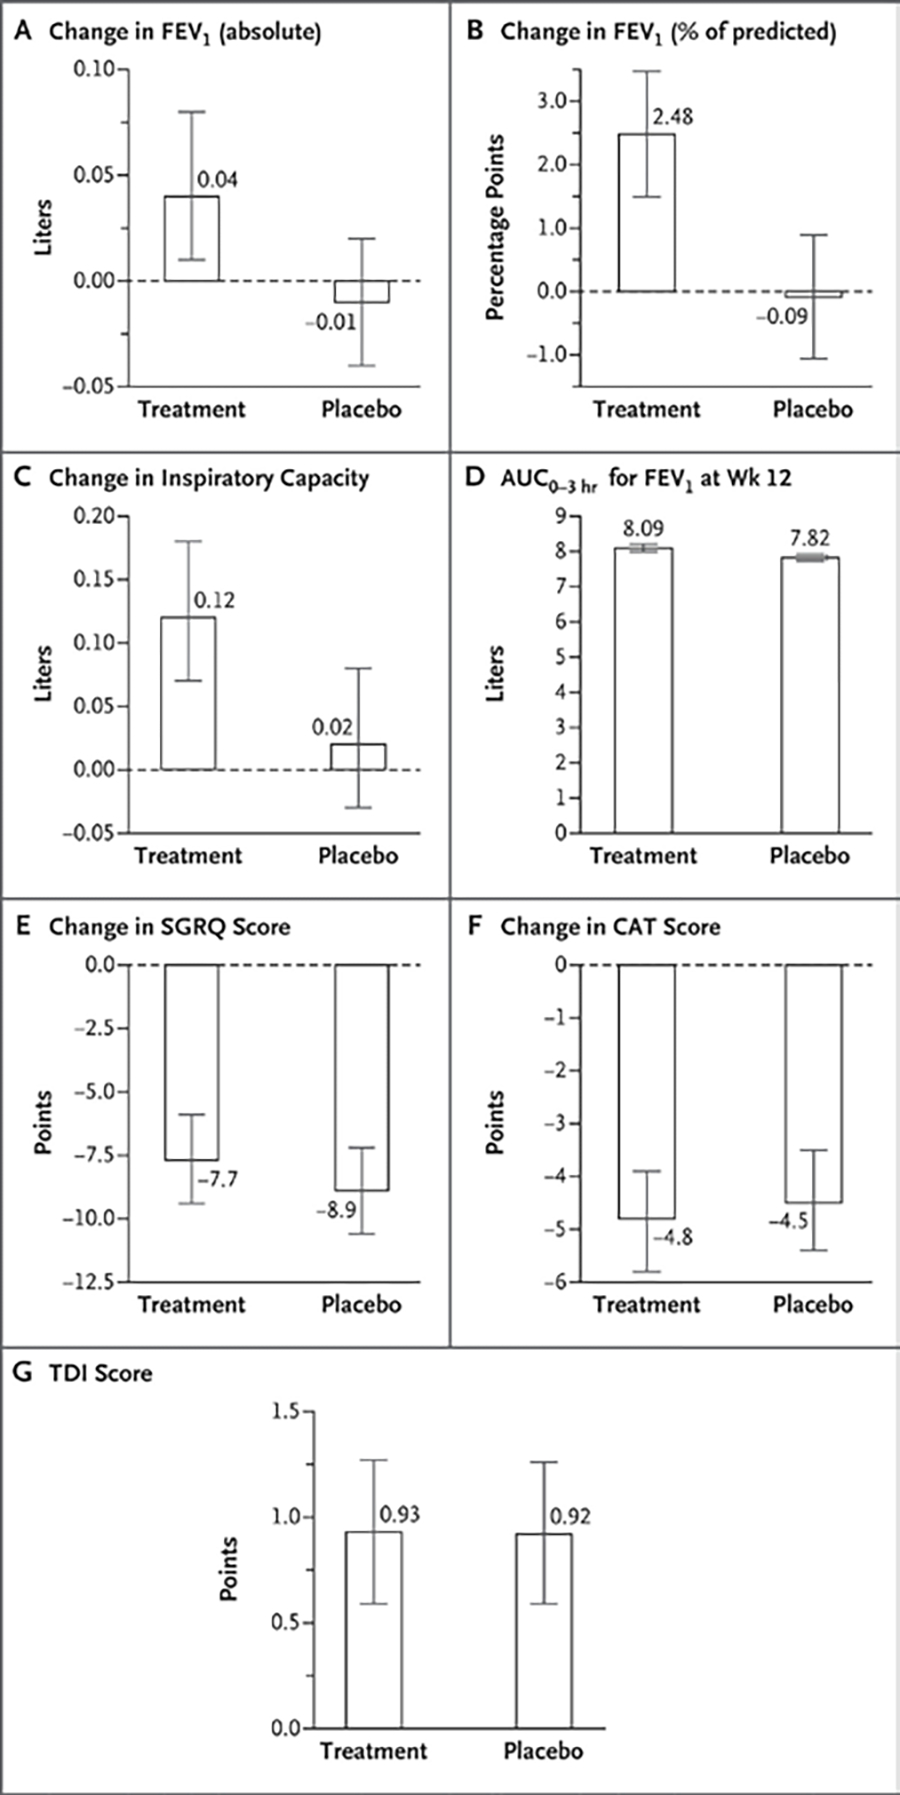
Changes in lung-function measures were assessed as baseline prebronchodilator values as compared with those obtained 12 hours after the final dose of trial medication or placebo at 12 weeks. Heights of bars indicate the mean, and I bars indicate the 95% confidence interval based on linear mixed-effects model estimates. All changes were from baseline to the week 12 visit. AUC0–3hr is the area under the curve, assessed hourly over the first 3 hours after a dose. For all analyses shown here, 95% confidence intervals have not been adjusted for multiplicity and therefore cannot be used in place of hypothesis tests.