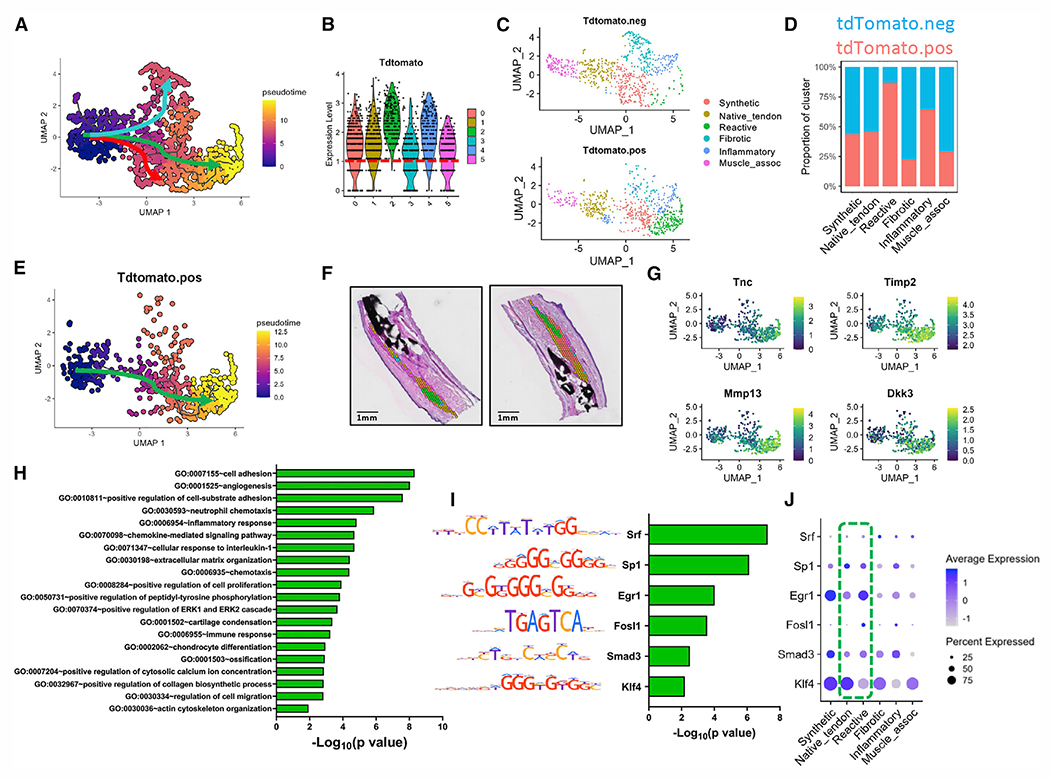
Figure 3. ScxAi9 pseudotime trajectory analysis from native tendon to the reactive cellular/molecular program.

(A) UMAP depicting differentiation pathways from C1native_tendon to C3fibrotic (blue arrow), C2reactive (green), and C0synthetic (red).
(B and C) Violin plot depicting expression pattern of (B) tdTomato, indicative of ScxAi9 cells, across all clusters and (C) tdTomato+/− subsets based on a cutoff of tdTomato >1 (red dotted line).
(D) Quantification of ScxAi9 spots per cluster.
(E) Pseudotime trajectory analysis for the tdTomato+ subset follows the reactive module pathway (green arrow).
(F and G) Spatial localization of C2reactive at day 21 post-injury (F), along with feature plots of representative genes enriched along the reactive differentiation route, including Timp2, Tnc, Mmp13, and Dkk3 (G).
(H) Identification of GO terms enriched the reactive module.
(I and J) TF binding motif analysis predicts transcription factors Srf, Sp1, Egr1, Fosl1, Smad3, and Klf4 as regulators of the reactive program trajectory (I), which are also shown with a dot plot (J) to demonstrate expression level and localization within clusters.
Green box highlights expression levels in native tendon and reactive tissue. Scale bars represent 1 mm.
See also Figure S5.
