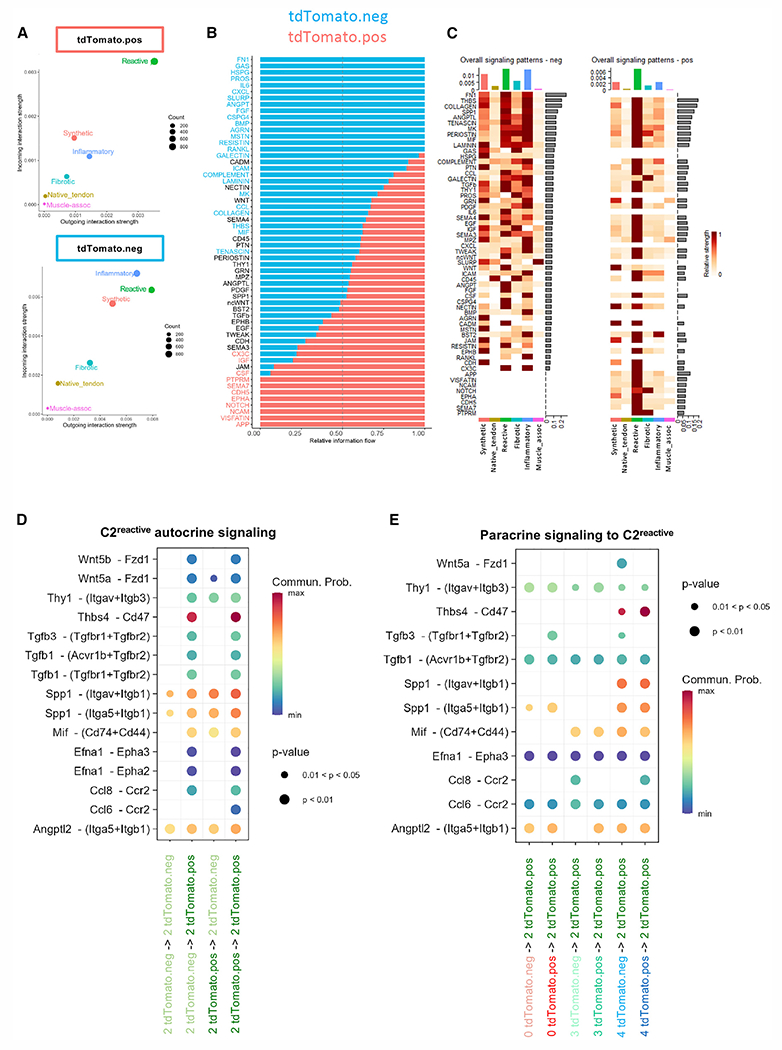
Figure 6. Identification of the interactome in relation to the ScxLin+ population.

(A) Overall interaction strength of each cluster in the tdTomato+ subset (top) and tdTomato− subset (bottom) demonstrates differential interaction strength for C2reactive.
(B) Relative information flow between subpopulations; top signaling pathways colored red are enriched in the tdTomato+ subset, and those colored blue enriched in the tdTomato− subset.
(C) Overall signaling patterns for each subset breaks down the overall information flow to demonstrate which integrated clusters participate in the top signaling pathways.
(D) Dot plot of the identified ligand-receptor interactions within and between the tdTomato+ and tdTomato− subsets in C2reactive.
(E) Dot plot of ligand-receptor interactions between the tdTomato+ and tdTomato− subsets of C0synthetic, C3fibrotic, and C4inflammatory to the tdTomato+ subset of C2reactive. Dot size and color indicate the significance of the interaction (given as a range of p values), and the probably of communication, respectively.
See also Figures S6 and S7.
