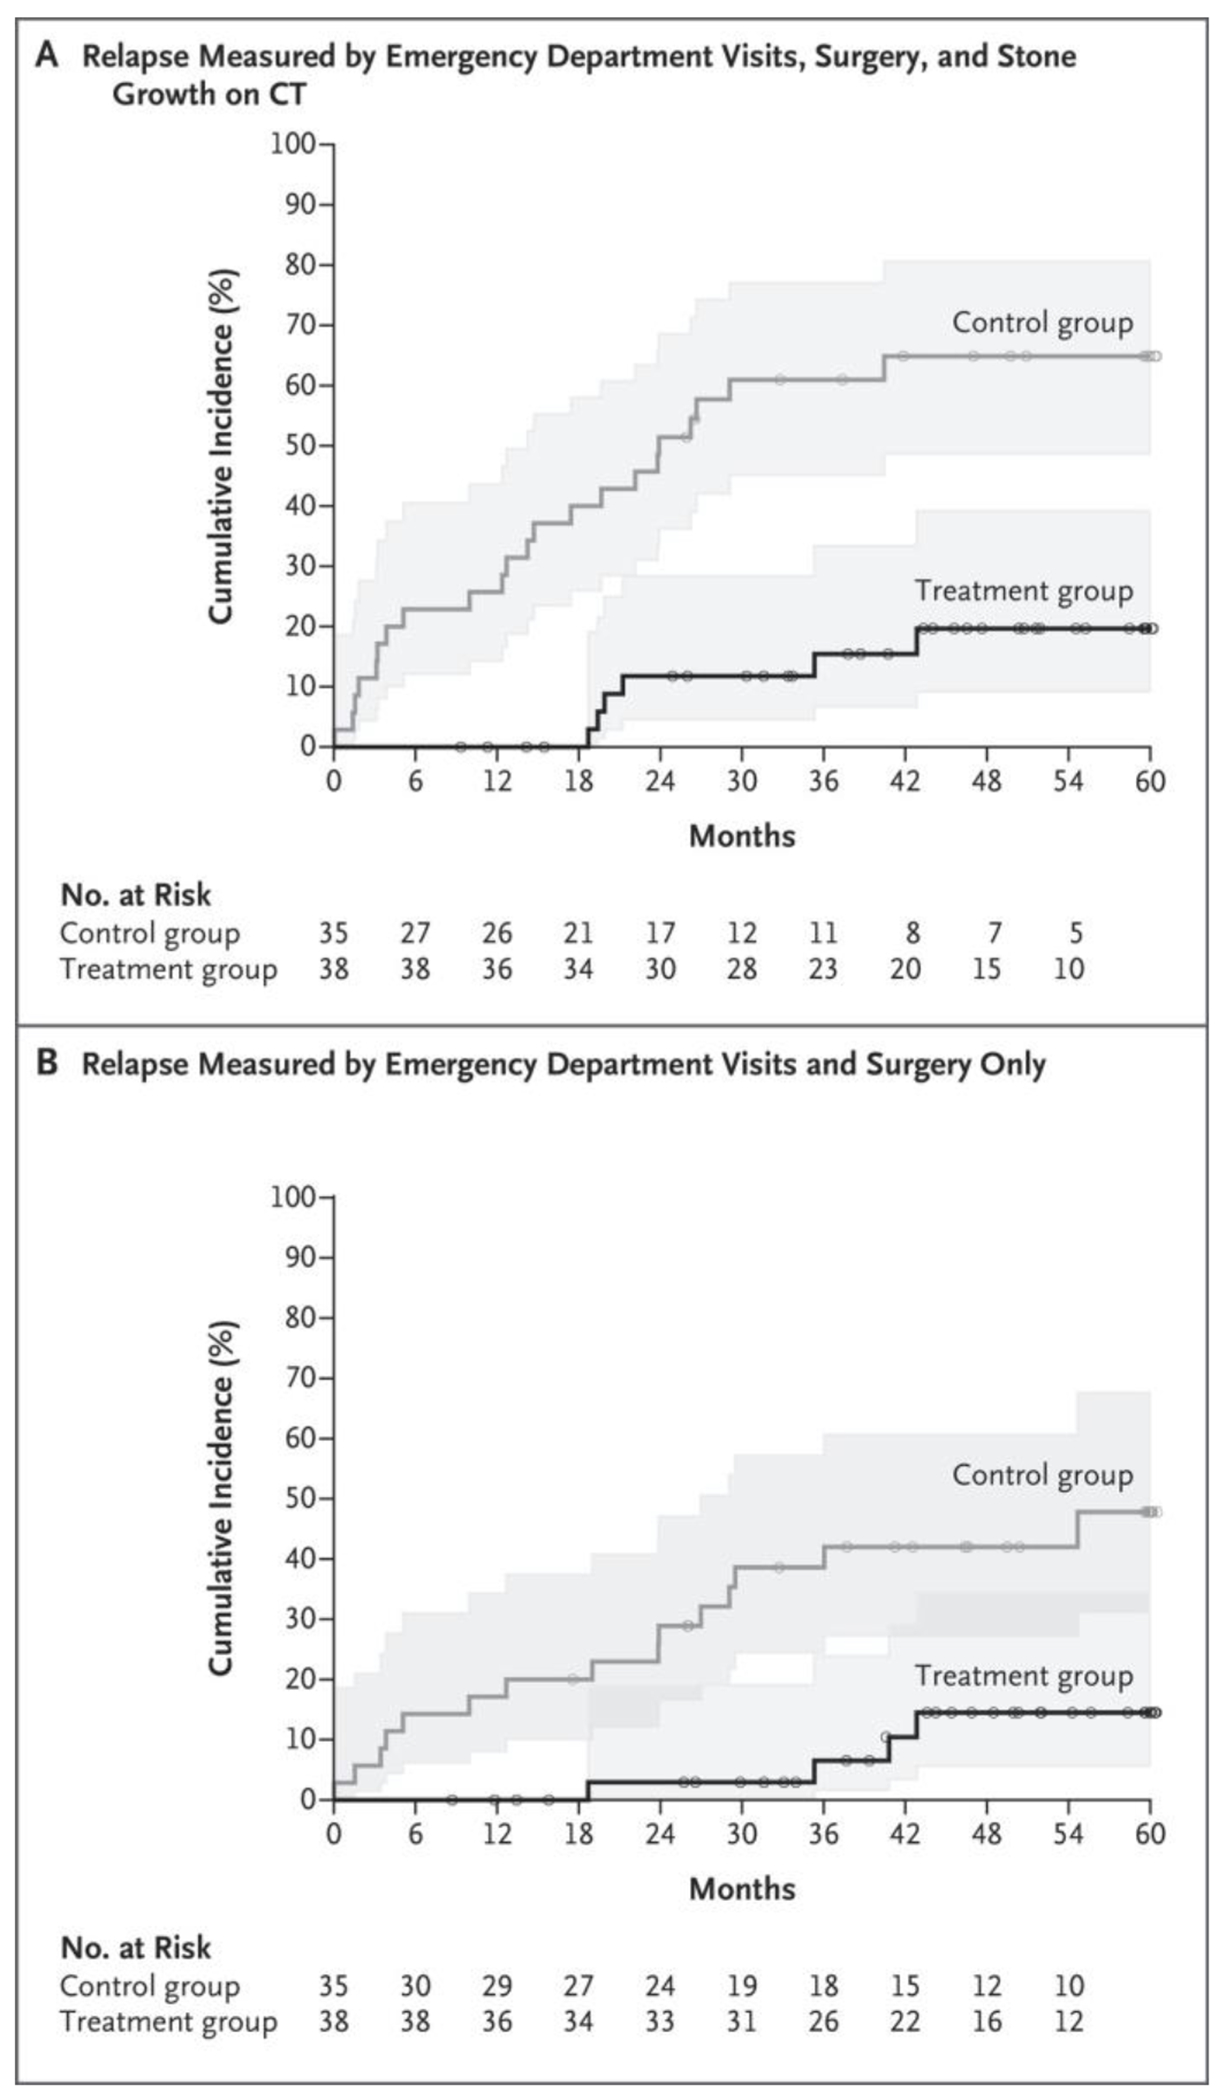
Figure 2. Cumulative Incidence of Relapse.

Shaded areas represent 95% confidence intervals. Small circles represent censored data. Patient relapse data were censored when the patient did not have a relapse before being lost to follow-up or by the end of follow-up. CT denotes computed tomography.
