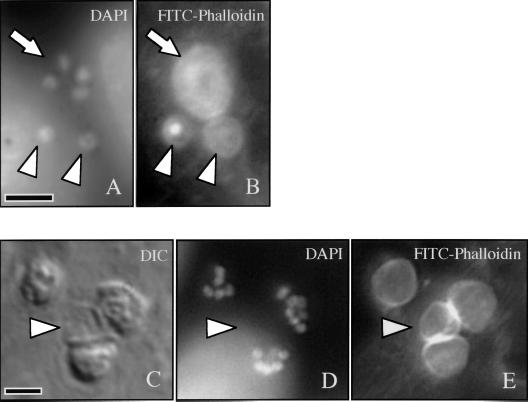
FIG. 2.
Fluorescence microscopy of a Cryptosporidium-infected cell line stained with DAPI (A) reveals a meront with four nuclei (arrow) and two trophozoites with single nuclei (arrowheads). FITC-phalloidin staining of the same field (B) demonstrates the circular f-actin plaque associated with each parasite. Note the intense central staining of one trophozoite-associated plaque (left arrowhead). A DIC image of another field shows four sites of infection (C), with one parasite removed by exposure to a hypotonic solution (arrowhead). DAPI staining of the same field (D) reveals multiple nuclei within the remaining three parasites. FITC-phalloidin staining of this field (E) demonstrates the circular f-actin plaque associated with each site of invasion, including the site from which the developing parasite was removed (arrowhead). Scale bars = 5 μm.

