FIGURE 2.

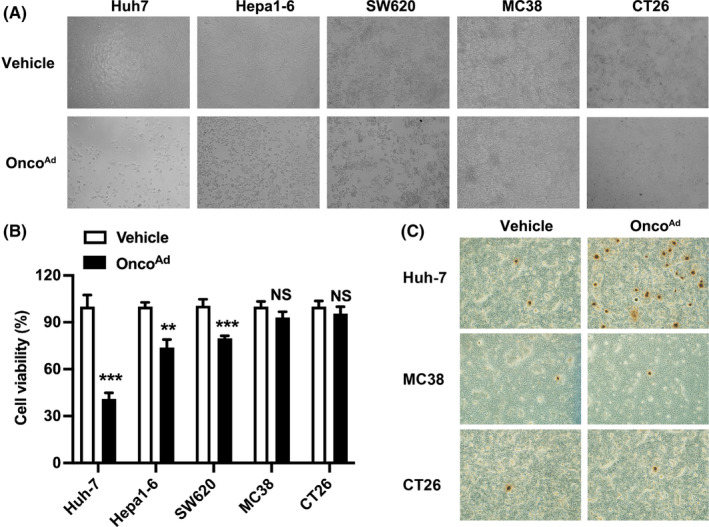
Characteristics of OncoAd in vitro. (A) Cytotoxicity of OncoAd in CRC cells (SW620, MC38, and CT26) and HCC (Huh7 and Hepa1‐6). Representative images displayed cell viability after 48 h of OncoAd treatment. (B) Quantification of positive tumor cells. Significance was determined using the t‐test, and all data are presented as mean ± SEM values. Significance is indicated as *p < 0.05 or **p < 0.01 or ***p < 0.001. (C) Proliferation of Huh7, and CT26 cells after OncoAd infection. Brown represents positive infected cells.
