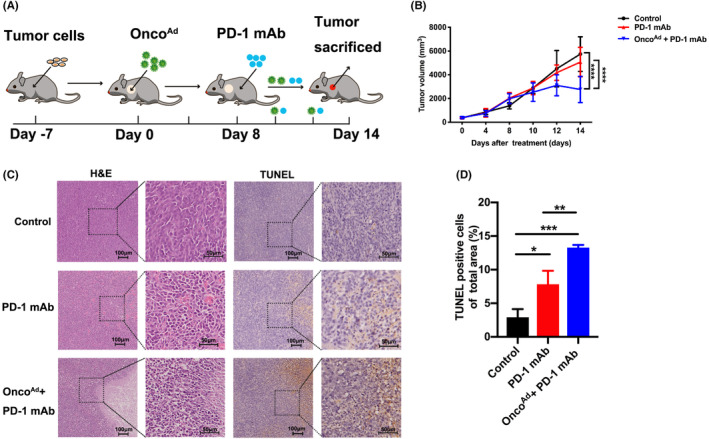
FIGURE 4.

Anti‐tumor efficacy of combinatorial treatment with OncoAd and PD‐1 mAb therapy in the CT26 mouse model. (A) Schematic representation of different treatments given in the present study. (B) Relative tumor volume curve of CT26 tumors after treatment with PD‐1 mAb, and combinatorial OncoAd and PD‐1 mAb therapy (n = 5; p < 0.05). (C) Tumor necrosis in tumor sections, as indicated through H&E staining. Apoptosis in tumor sections was examined through TUNEL staining. (D) Quantification of positive cells via ImageJ software following TUNEL staining (n = 5; p < 0.01). Scale bar = 50 or 100 μm. Significance is indicated as *p < 0.05 or **p < 0.01.
