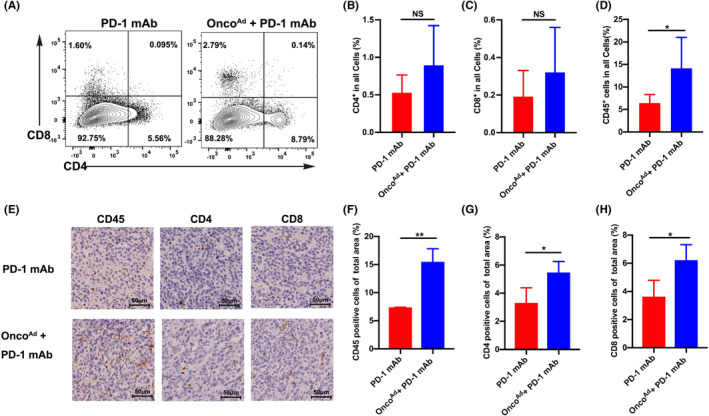
FIGURE 5.

OncoAd enhanced the immune response of PD‐1 mAb therapy in the CT26 mouse model. (A–C) Representative contour plots of CD4+ and CD8+ T cells in the CRC mouse model (left) after combinatorial OncoAd and PD‐1 mAb therapy; percentages of CD4+ and CD8+ T cells are indicated on the right (B, C). (D) Percentages of immune cells upon combinatorial OncoAd and PD‐1 mAb therapy compared to PBS treatment. Analysis of the phenotype of CD45+ T cells (D) after combinatorial OncoAd and PD‐1 mAb therapy. (E) Immunohistochemical staining for CD45, CD4, and CD8 in the tumor after combinatorial OncoAd and PD‐1 mAb therapy. (F–H) Quantification of positive cells via ImageJ software following CD45 (F), CD4 (G), and CD8 (H) staining. Significance is indicated as *p < 0.05 or **p < 0.01.
