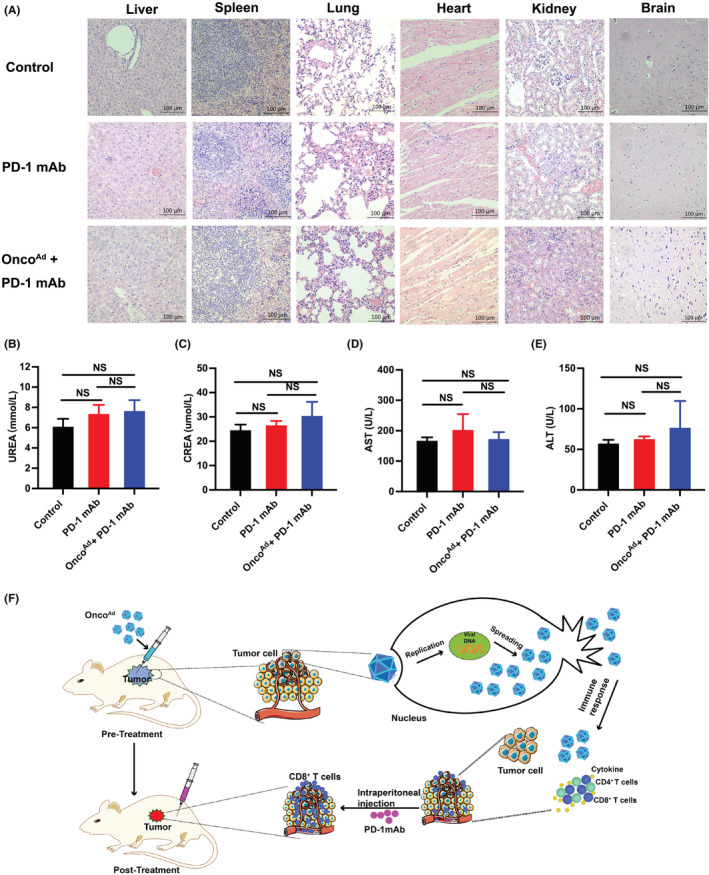
FIGURE 6.

Immune response of tumor microenvironment after combinatorial OncoAd and PD‐1 mAb therapy in the CT26 mouse model. (A) Organ toxicity was assessed through H&E staining of samples of the liver, spleen, lung, hearts, kidneys, and brain (n = 3, *p < 0.05 and **p < 0.01). Magnification 10×. (B–E) Biochemical analysis after combinatorial treatment with OncoAd and PD‐1 mAb in CRC mouse model. Quantification ALT, AST, CREA, and UREA are presented. (F) Schematic mechanism of combinatorial treatment with OncoAd and PD‐1 mAb therapy in the CRC mouse model.
