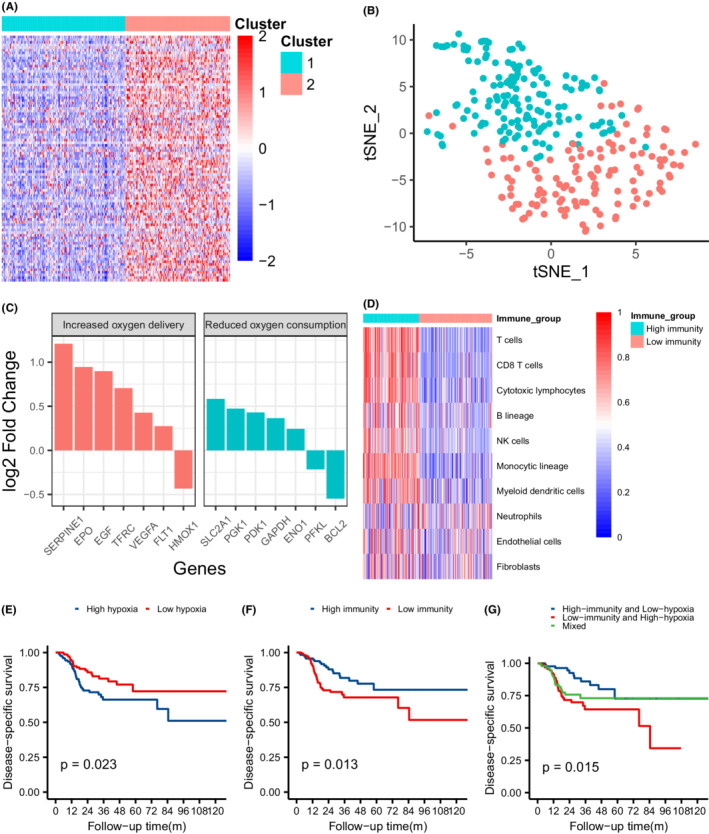
FIGURE 2.

Identification of hypoxia and tumor microenvironment status and their association with response to radiotherapy in the TCGA cohort. (A) Heatmap showing the expression pattern of hypoxia gene sets in two clusters. (B) t‐SNE plots of all patients separated into two clusters labeled by color. (C) Expression changes of genes involved in the HIF1 KEGG pathway (high hypoxia group vs. low hypoxia group). (D) Heatmap showing quantification of eight immune and two stromal populations estimated by MCP‐counter. (E) Kaplan–Meier curves of disease‐specific survival for patients in two hypoxia groups. (F) Kaplan–Meier curves of disease‐specific survival for patients in two immunity groups. (G) Kaplan–Meier curves of disease‐specific survival for patients in three hypoxia‐immunity groups
