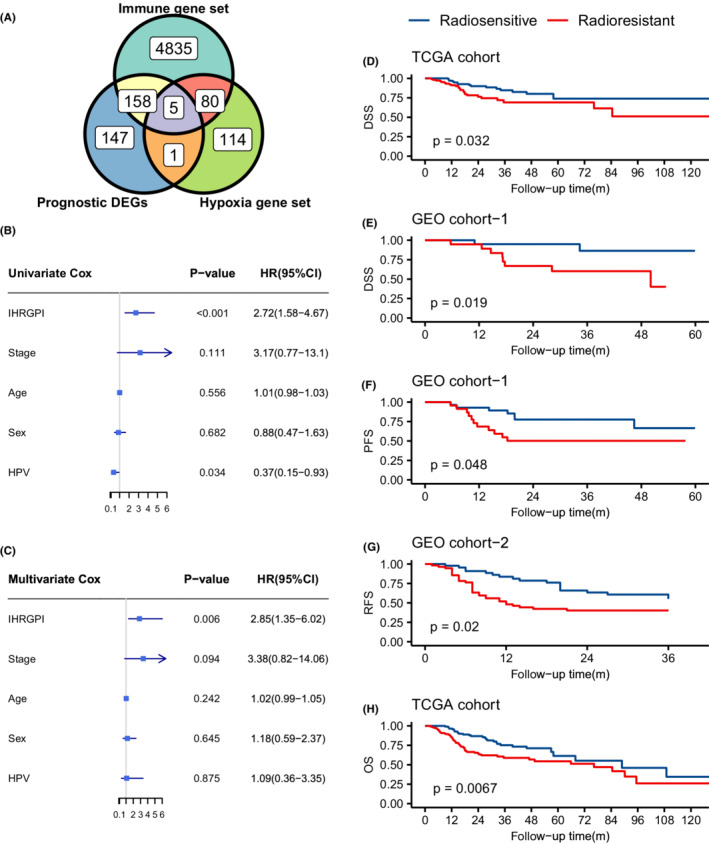
FIGURE 3.

Construction and validation of the IHRGPI model. (A) Venn diagram showing the intersection between the immune‐hypoxia‐related prognostic differentially expressed genes, hypoxia gene sets, and immune gene sets. (B) Forest plot demonstrating the univariate Cox regression of IHRGPI and common clinicopathological characteristics. (C) Forest plot demonstrating the multivariate Cox regression of IHRGPI and the common clinicopathological characteristics. (D) Kaplan–Meier curves for disease‐specific survival in the TCGA cohort. (E) Kaplan–Meier curves for disease‐specific survival in GEO cohort‐1. (F) Kaplan–Meier curves for progression‐free survival in GEO cohort‐1. (G) Kaplan–Meier curves for recurrence‐free survival in GEO cohort‐2. (H) Kaplan–Meier curves for overall survival in TCGA cohort. IHRGPI, immune‐hypoxia‐related gene prognostic index; DSS, disease‐specific survival; PFS, progression‐free survival; RFS, recurrence‐free survival; OS, overall survival
