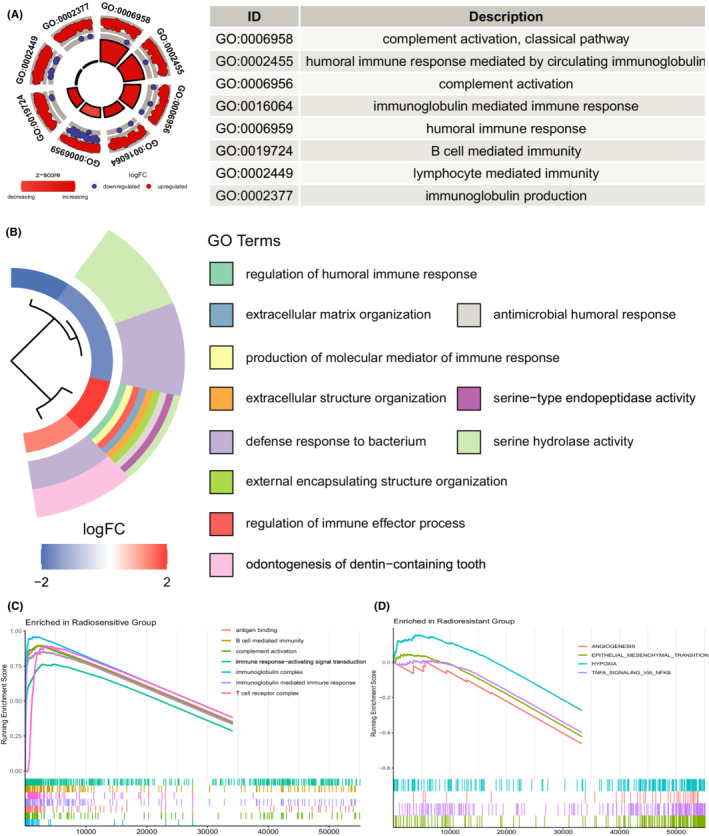
FIGURE 4.

Functional enrichment analysis. (A) GOCircle plot showing the top eight GO terms based on the adjusted p‐values. (B) GOcluster plot showing the clustering of GO terms based on Euclidean distances and average linkage. (C) Gene sets enriched in the radiosensitive group by GSEA. (D) Gene sets enriched in the radioresistant group by GSEA. GSEA, gene set enrichment analysis
