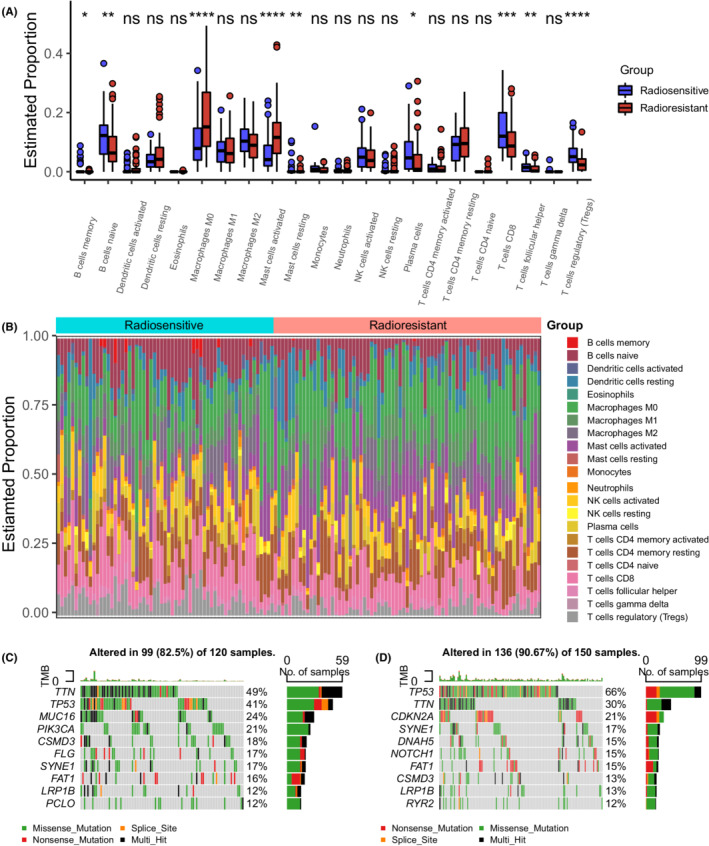
FIGURE 5.

The immune and mutational landscape. (A) Boxplot comparing the proportions of different types of immune cells in tumor tissues estimated by Cibersort between the two IHRGPI groups (ns: not significant, *p < 0.05, **p < 0.01, ***p < 0.001, ****p < 0.0001). (B) 100% stacked bar plot comparing the proportion of different type of immune cells in each patient between the two IHRGPI groups. (C) Top 10 mutated genes and their mutational types in the radiosensitive group. (D) Top 10 mutated genes and their mutational types in the radioresistant group. IHRGPI, immune‐hypoxia‐related gene prognostic index
