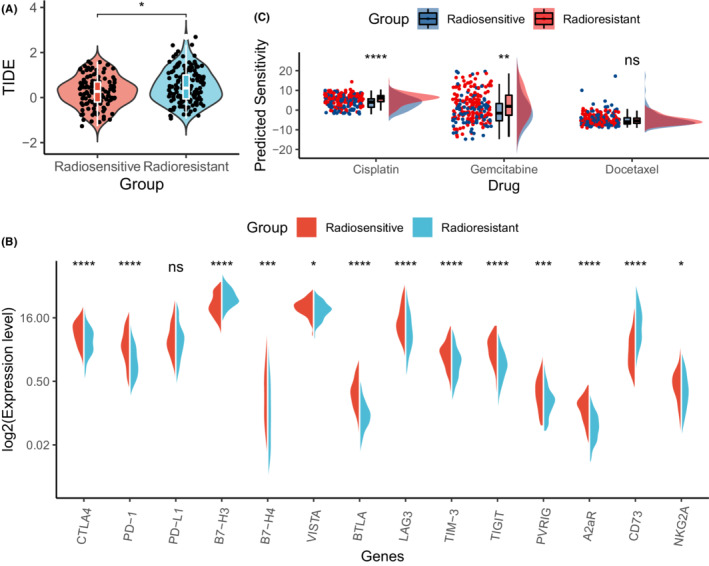
FIGURE 6.

Sensitivity to different types of treatment in the two IHRGPI groups. (A) Violin plot showing the difference in TIDE score between the two IHRGPI groups. (B) Split violin plot demonstrating the difference in log‐transformed expression levels of the well‐studied targets of the immune checkpoint inhibitors between the two IHRGPI groups. (C) Rainfall plot comparing the predicted sensitivity to three commonly‐used chemotherapeutic drugs between the two IHRGPI groups. (ns: not significant, *p < 0.05, **p < 0.01, ***p < 0.001, ****p < 0.0001). TIDE, Tumor Immune Dysfunction and Exclusion; IHRGPI, immune‐hypoxia‐related gene prognostic index
