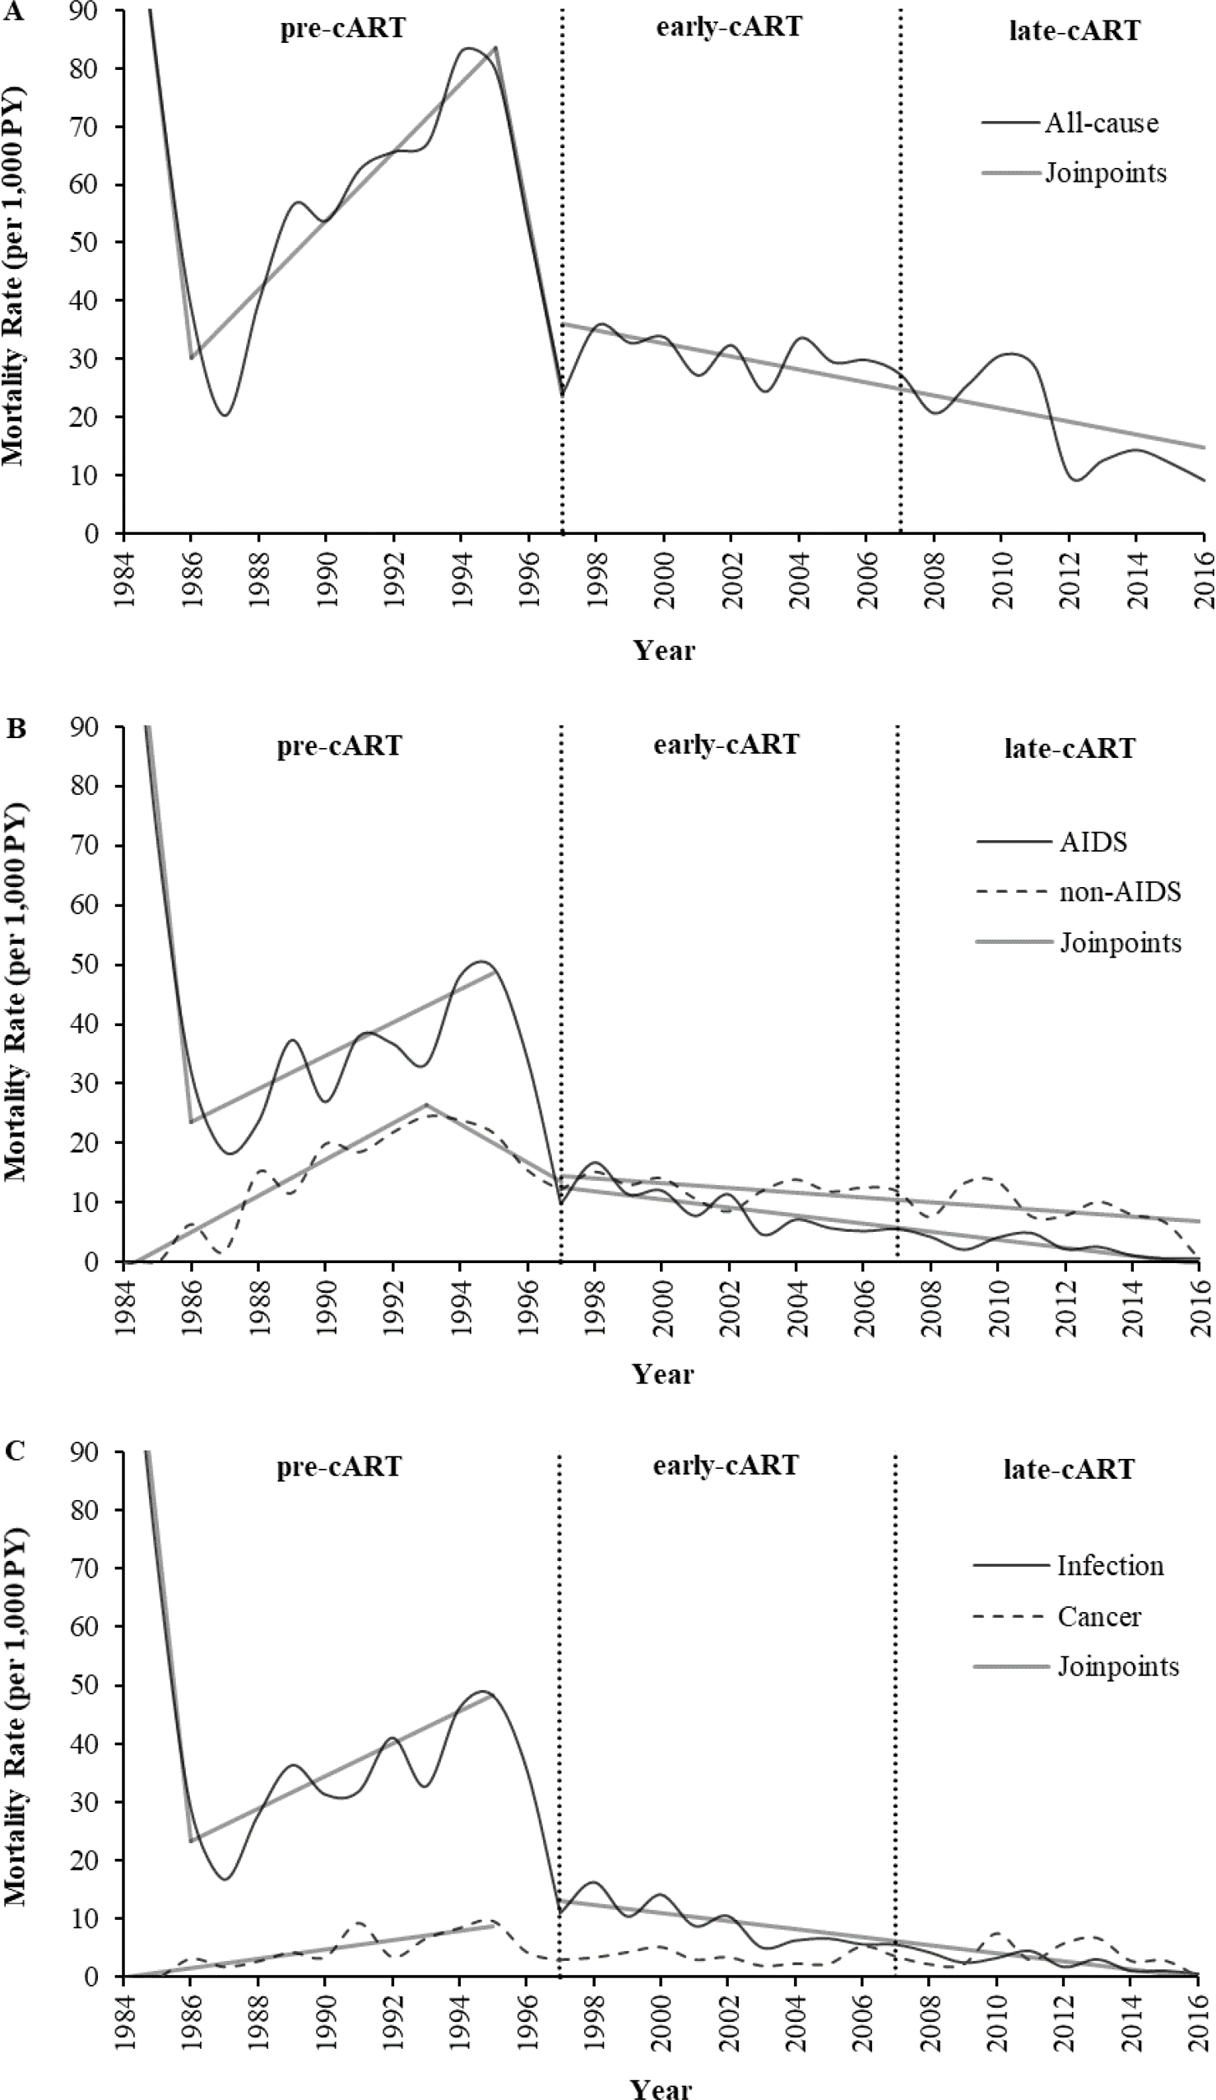
Figure 1. Joinpoint regression analysis of age-adjusted mortality rates in Veterans with HIV during the pre-, early-, and late-cART eras (n=4,674).

A, all-cause mortality rates (n=1,752); APC: 1984–1986 (−49.3), 1986–1995 (5.9), 1995–1997 (−29.9), 1997–2016 (−1.1). B, AIDS- (n=724) and non-AIDS-related (n=687) mortality rates; APC (AIDS): 1984–1986 (−52.6), 1986–1995 (2.8), 1997–2016 (−0.4); APC (non-AIDS): 1984–1993 (3.1), 1993–1997 (−3.2), 1997–2016 (−0.7). C, infection (including AIDS- and non-AIDS-related infections; n=727) and cancer (including AIDS- and non-AIDS-related cancers; n=221) mortality rates; APC (infection): 1984–1986 (−52.8), 1986–1995 (2.8), 1997–2016 (−0.7); APC (cancer): 1984–1995 (0.8). Age-adjusted mortality rates depicted have been smoothed. AIDS, acquired immune deficiency syndrome; APC, annual percent change; cART, combination antiretroviral therapy; early-cART era (1997–2006); HIV, human immunodeficiency virus; late-cART era (2007–2016); pre-cART era (1984–1996); PY, person-year.
