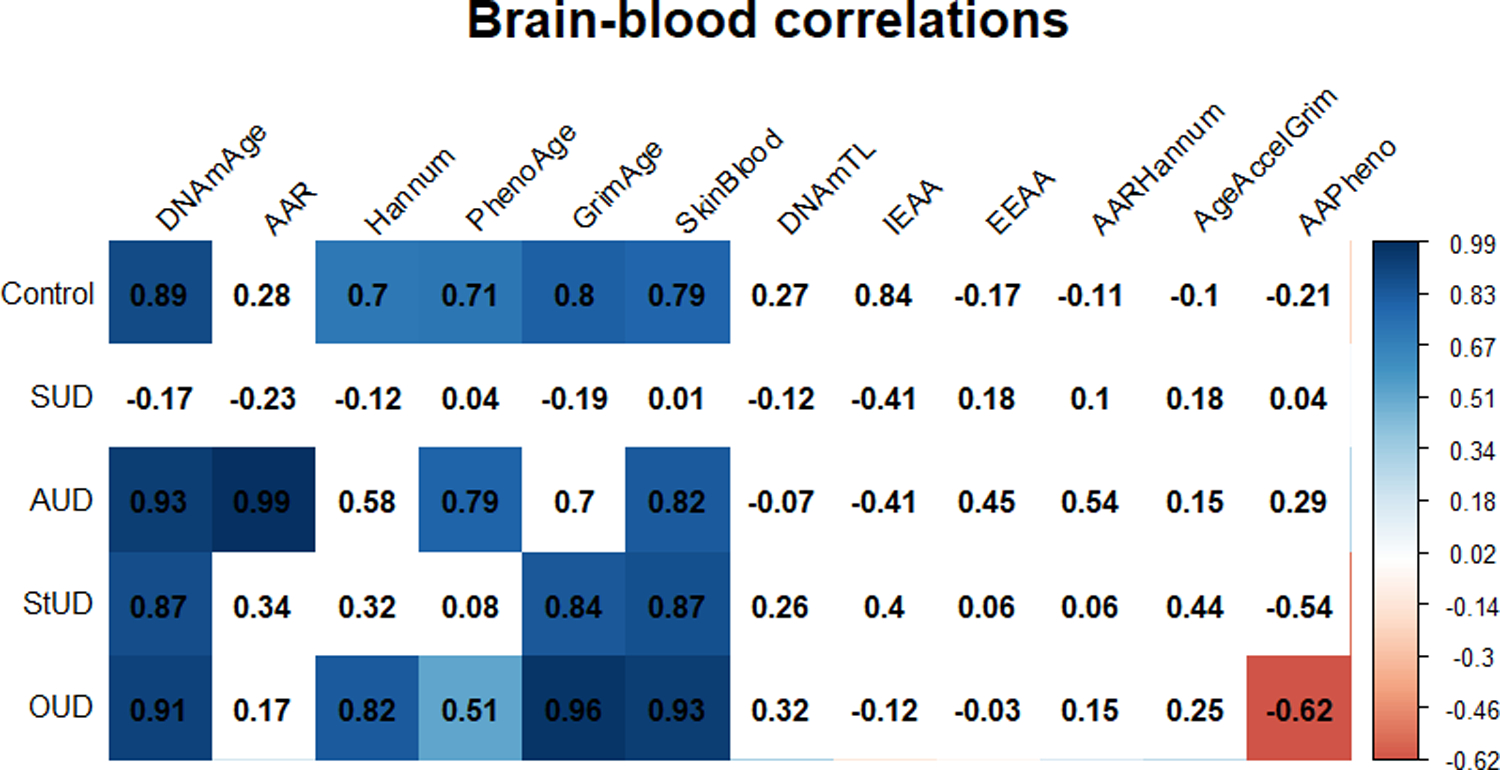
Figure 7.

Matrix plot of correlations between brain and blood epigenetic variables. Cells with a significant correlation (p-value <0.05) are colored according to their correlation coefficient for epigenetic variable-chronological age correlation, with red and blue indicating a negative and a positive correlation, respectively. The correlation coefficient is indicated in the number within each cell. Abbreviations: Substance use disorder (SUD); Alcohol use disorder (AUD); Stimulants use disorder (StUD); Opioid use disorder (OUD); DNAmAge-based epigenetic age acceleration (AAR); Extrinsic epigenetic age acceleration (EEAA); Intrinsic epigenetic age acceleration (IEAA); Hannum-based epigenetic age acceleration (AAHannum); GrimAge-based epigenetic age acceleration (AAGrim); PhenoAge-based epigenetic age acceleration (AAPheno).
