Figure 1.
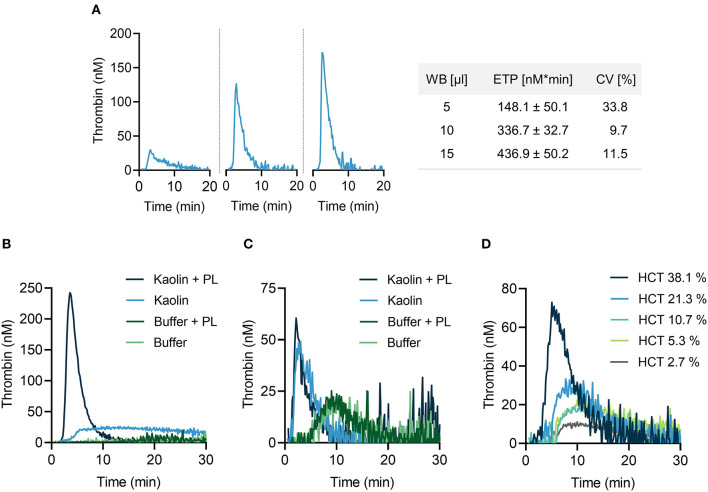
Thrombin generation (TG) in mouse whole blood assessed by CAT assay. (A) Left panel: real-time TG curves in 5 μl (left), 10 μl (middle) or 15 μl (right) recalcified mouse citrate whole blood. Right panel: corresponding endogenous thrombin potential (ETP) values. Data are presented as mean ± standard deviation (SD) of 10 replicates and coefficient of variation (CV) was calculated thereof. (B,C) TG measurements performed in mouse PPP (B) and whole blood (C) in the presence or absence of phospholipids (PL, 4 μM). PPP and whole blood activated with buffer only served as control. (D) A fixed volume of mouse PPP was supplemented with increasing concentrations of erythrocytes as indicated by hematocrit levels (HCT, 2.7–38.1 %). In all experiments shown, TG was stimulated with kaolin (10 μg/ml). Representative TG curves measured in triplicates of n = 3 individual experiments.

