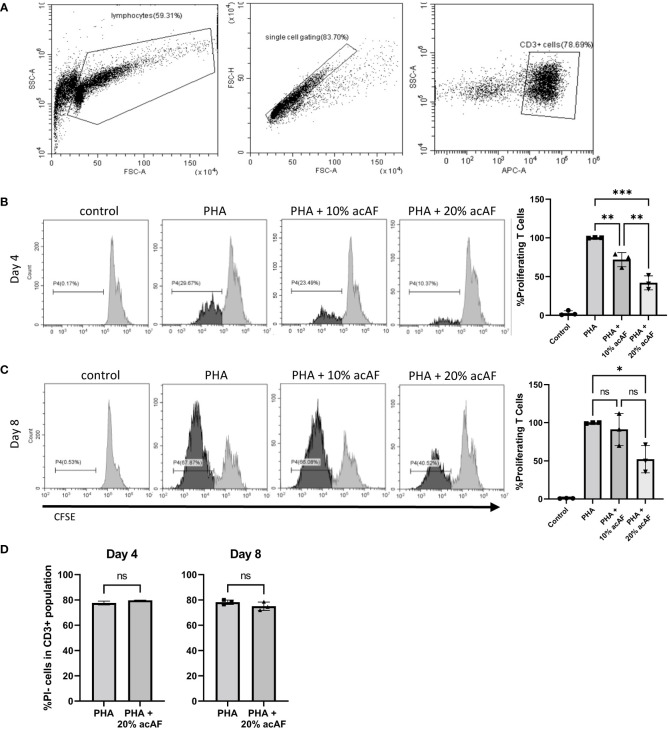
Figure 1.
AcAF Attenuates T Cell Proliferation 4 and 8 days after PHA Stimulation (A) Representative flow cytometry CD3+ gating. Representative histograms of proliferating CD3+ T cells in each group and graphed as percentages of the PHA vehicle control group following (B) 4-day PHA stimulation or (C) 8-day PHA stimulation. (D) Graphed percentages of PI- cells within CD3+ population. (Data graphed as mean ± SD; One way ANOVA with Tukey’s test; n=3 for each group; *=p<.05; **=p<.01; ***=p<.001; ns=not significant; Data is derived from 3 separate experiments. Each experiment used 1 independent PBMC donor treated with 1 of 3 acAF donors).

