Figure 3.
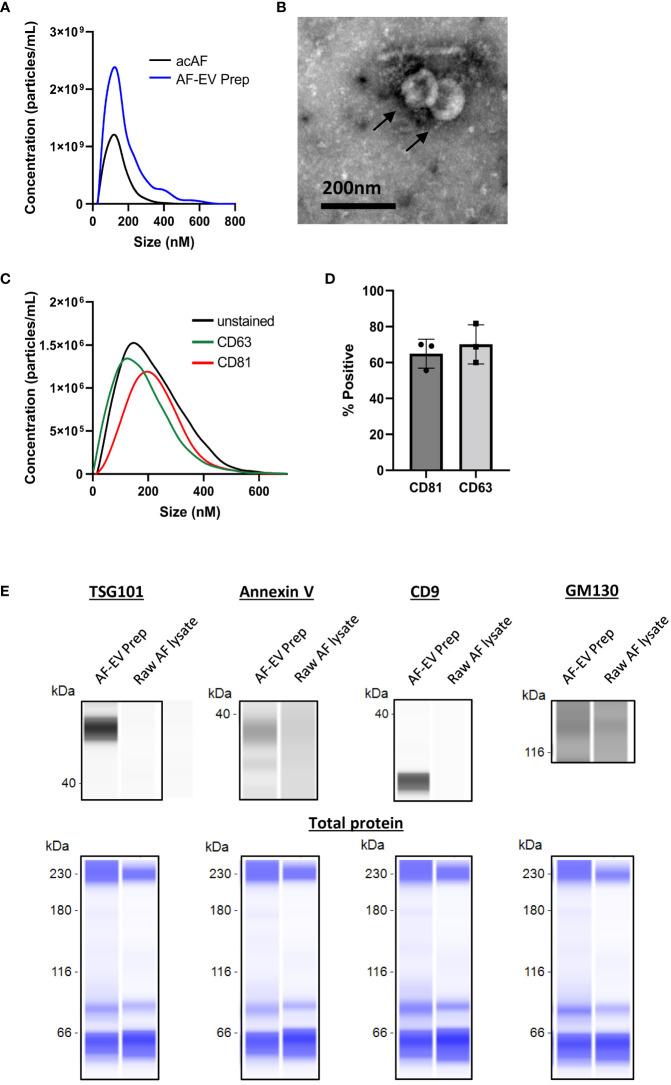
Characterization of AF-EVs (A) Comparison of nanoparticle populations between AcAF and EV Preparation samples (B) Transmission electron microscopy image of vesicles within EV preparation (C) Representative CD81+ and CD63+ particle populations in relation to total particle population of EV preparation (D) Percentage of particles in EV preparation expressing exosomal markers CD81 and CD63 (Data graphed as mean ± SD; n=3 samples). (E) Representative capillary western blots of EV markers (TSG101, Annexin V, and CD9) and of cellular Golgi body marker (GM130) in AF-EV Preparation samples and in raw, or unprocessed, AF lysate samples (top). The same amount of protein was loaded for each sample and total protein blots are shown in blue below each corresponding sample to visualize total loaded protein (bottom).

