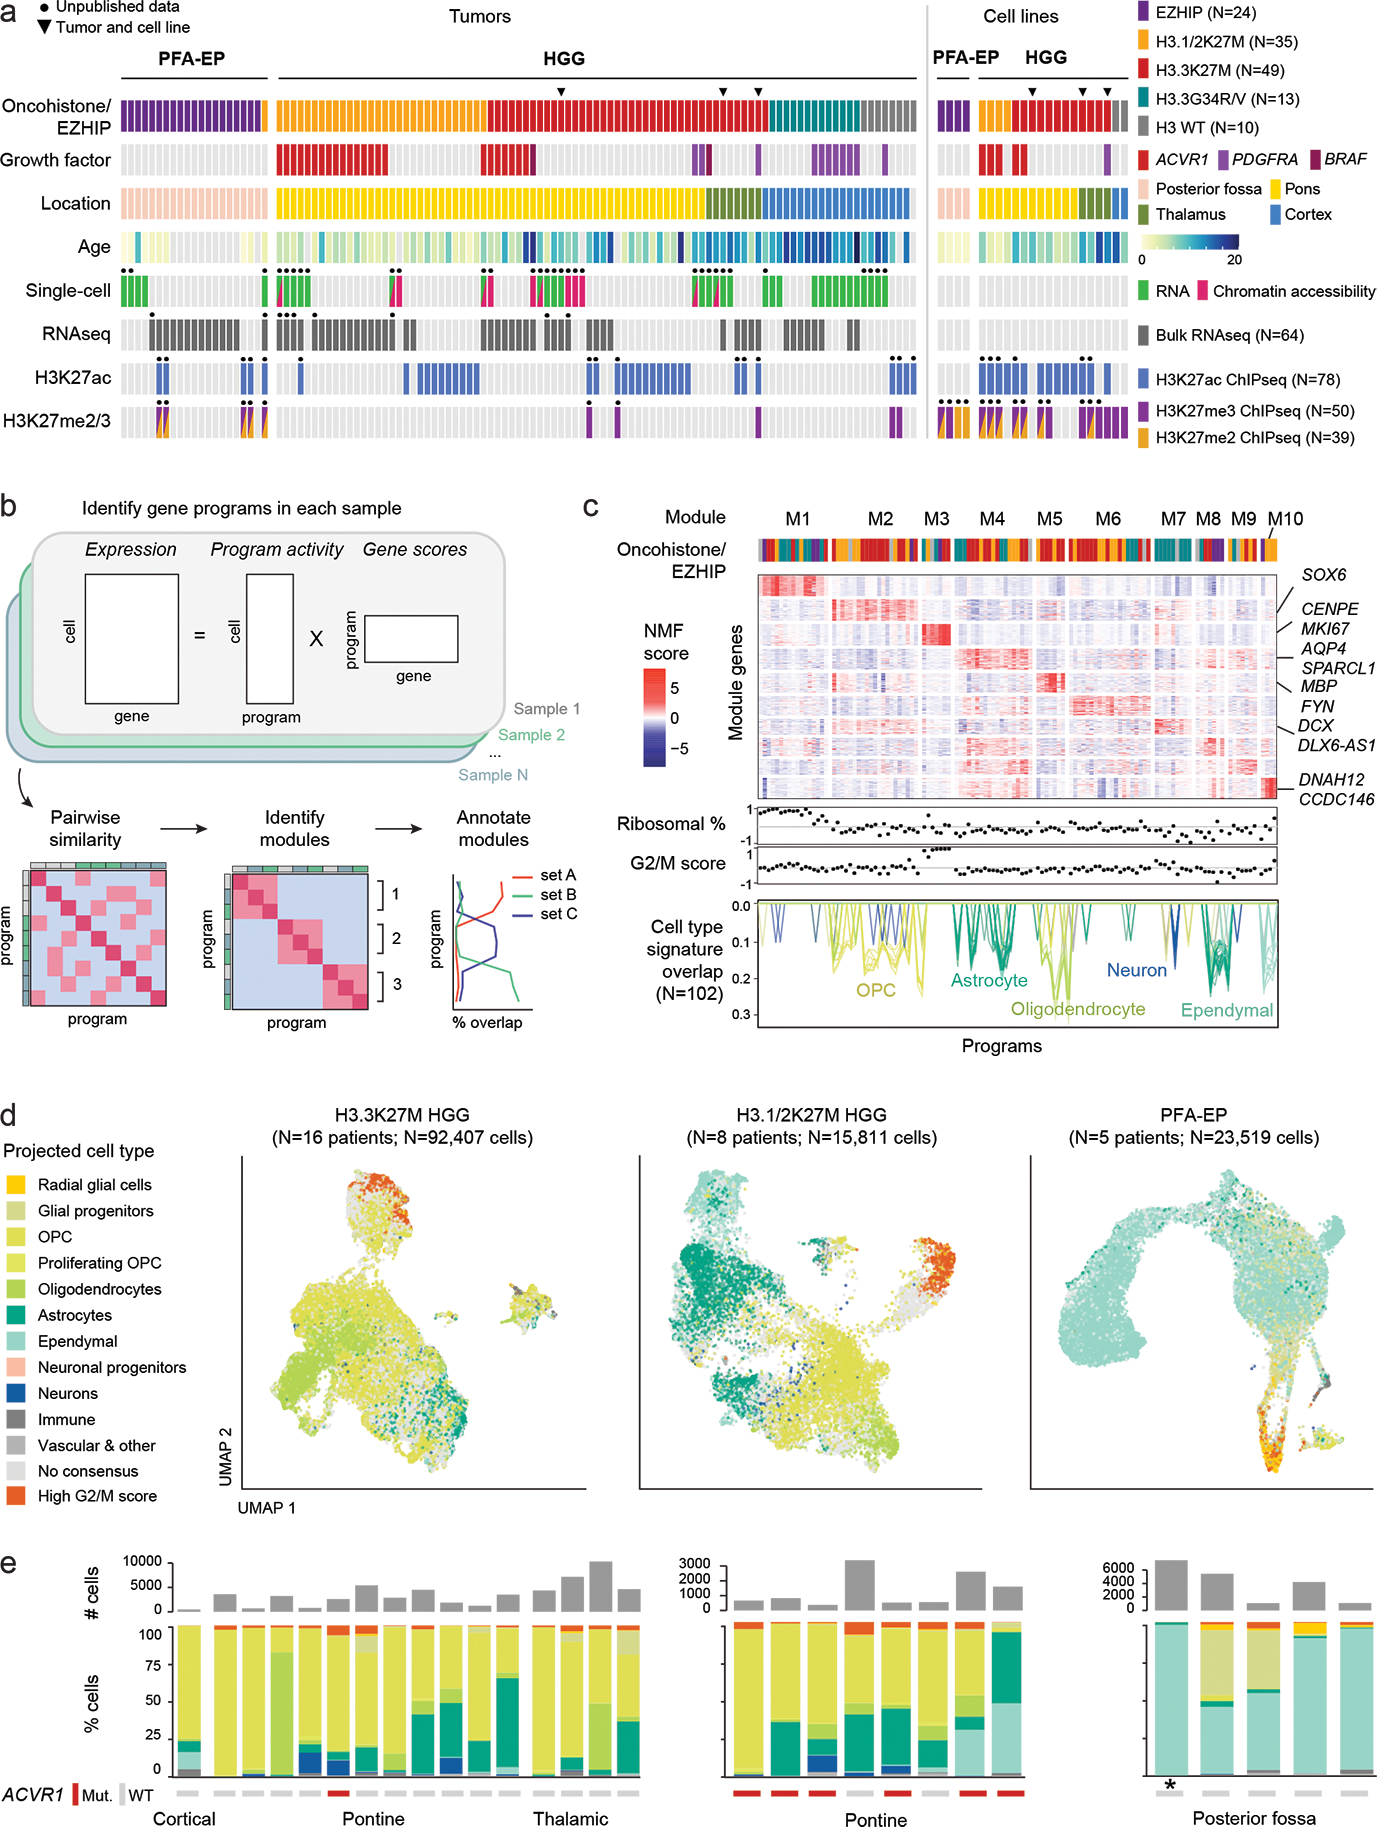
Figure 1. Unique cell type hierarchies in H3.1 and H3.3K27M HGGs.

a. Patient tumors (N=116 tumors from 112 patients) and patient-derived cell lines (N=22) included in this study. Black dots indicate that this study provides unpublished data for at least one sample for the corresponding assay/sample. Chromatin accessibility: 10x ATAC or 10x Multiome (ATAC & RNA). HGG: high-grade glioma; PFA-EP: posterior fossa ependymoma.
b. Workflow for unsupervised identification of recurrent gene programs in malignant cells using consensus Non-negative Matrix Factorization (cNMF).
c. Top: heatmap of NMF scores for all module-associated genes, across all programs. Column annotation shows the driver alteration of the sample in which each program was identified, colored as in (a). Middle: Correlation between each program and ribosomal content in each cell, and G2/M cell cycle score in each cell. Bottom: overlap between each program and developmental reference signatures, one line per signature. Only significant overlaps (empirical p-value < 0.001; see Methods and Supplementary Table 10) are shown, with number of significant overlaps indicated in parentheses.
d. UMAP for malignant cells of each tumor type. Projected cell types were obtained by mapping each individual tumor cell to a normal developmental brain reference, using a consensus of automated cell type prediction methods. Cells without a consensus label but with high G2/M cell cycle phase score are shown in orange.
e. Top: number of malignant cells per sample, for each tumor type as in (d). Bottom: quantification of consensus cell type projections among malignant cells. ACVR1 mutation status and tumor location are indicated below. Asterisk (*) denotes the single H3.1K27M-mutant sample among PFA-EP tumors.
