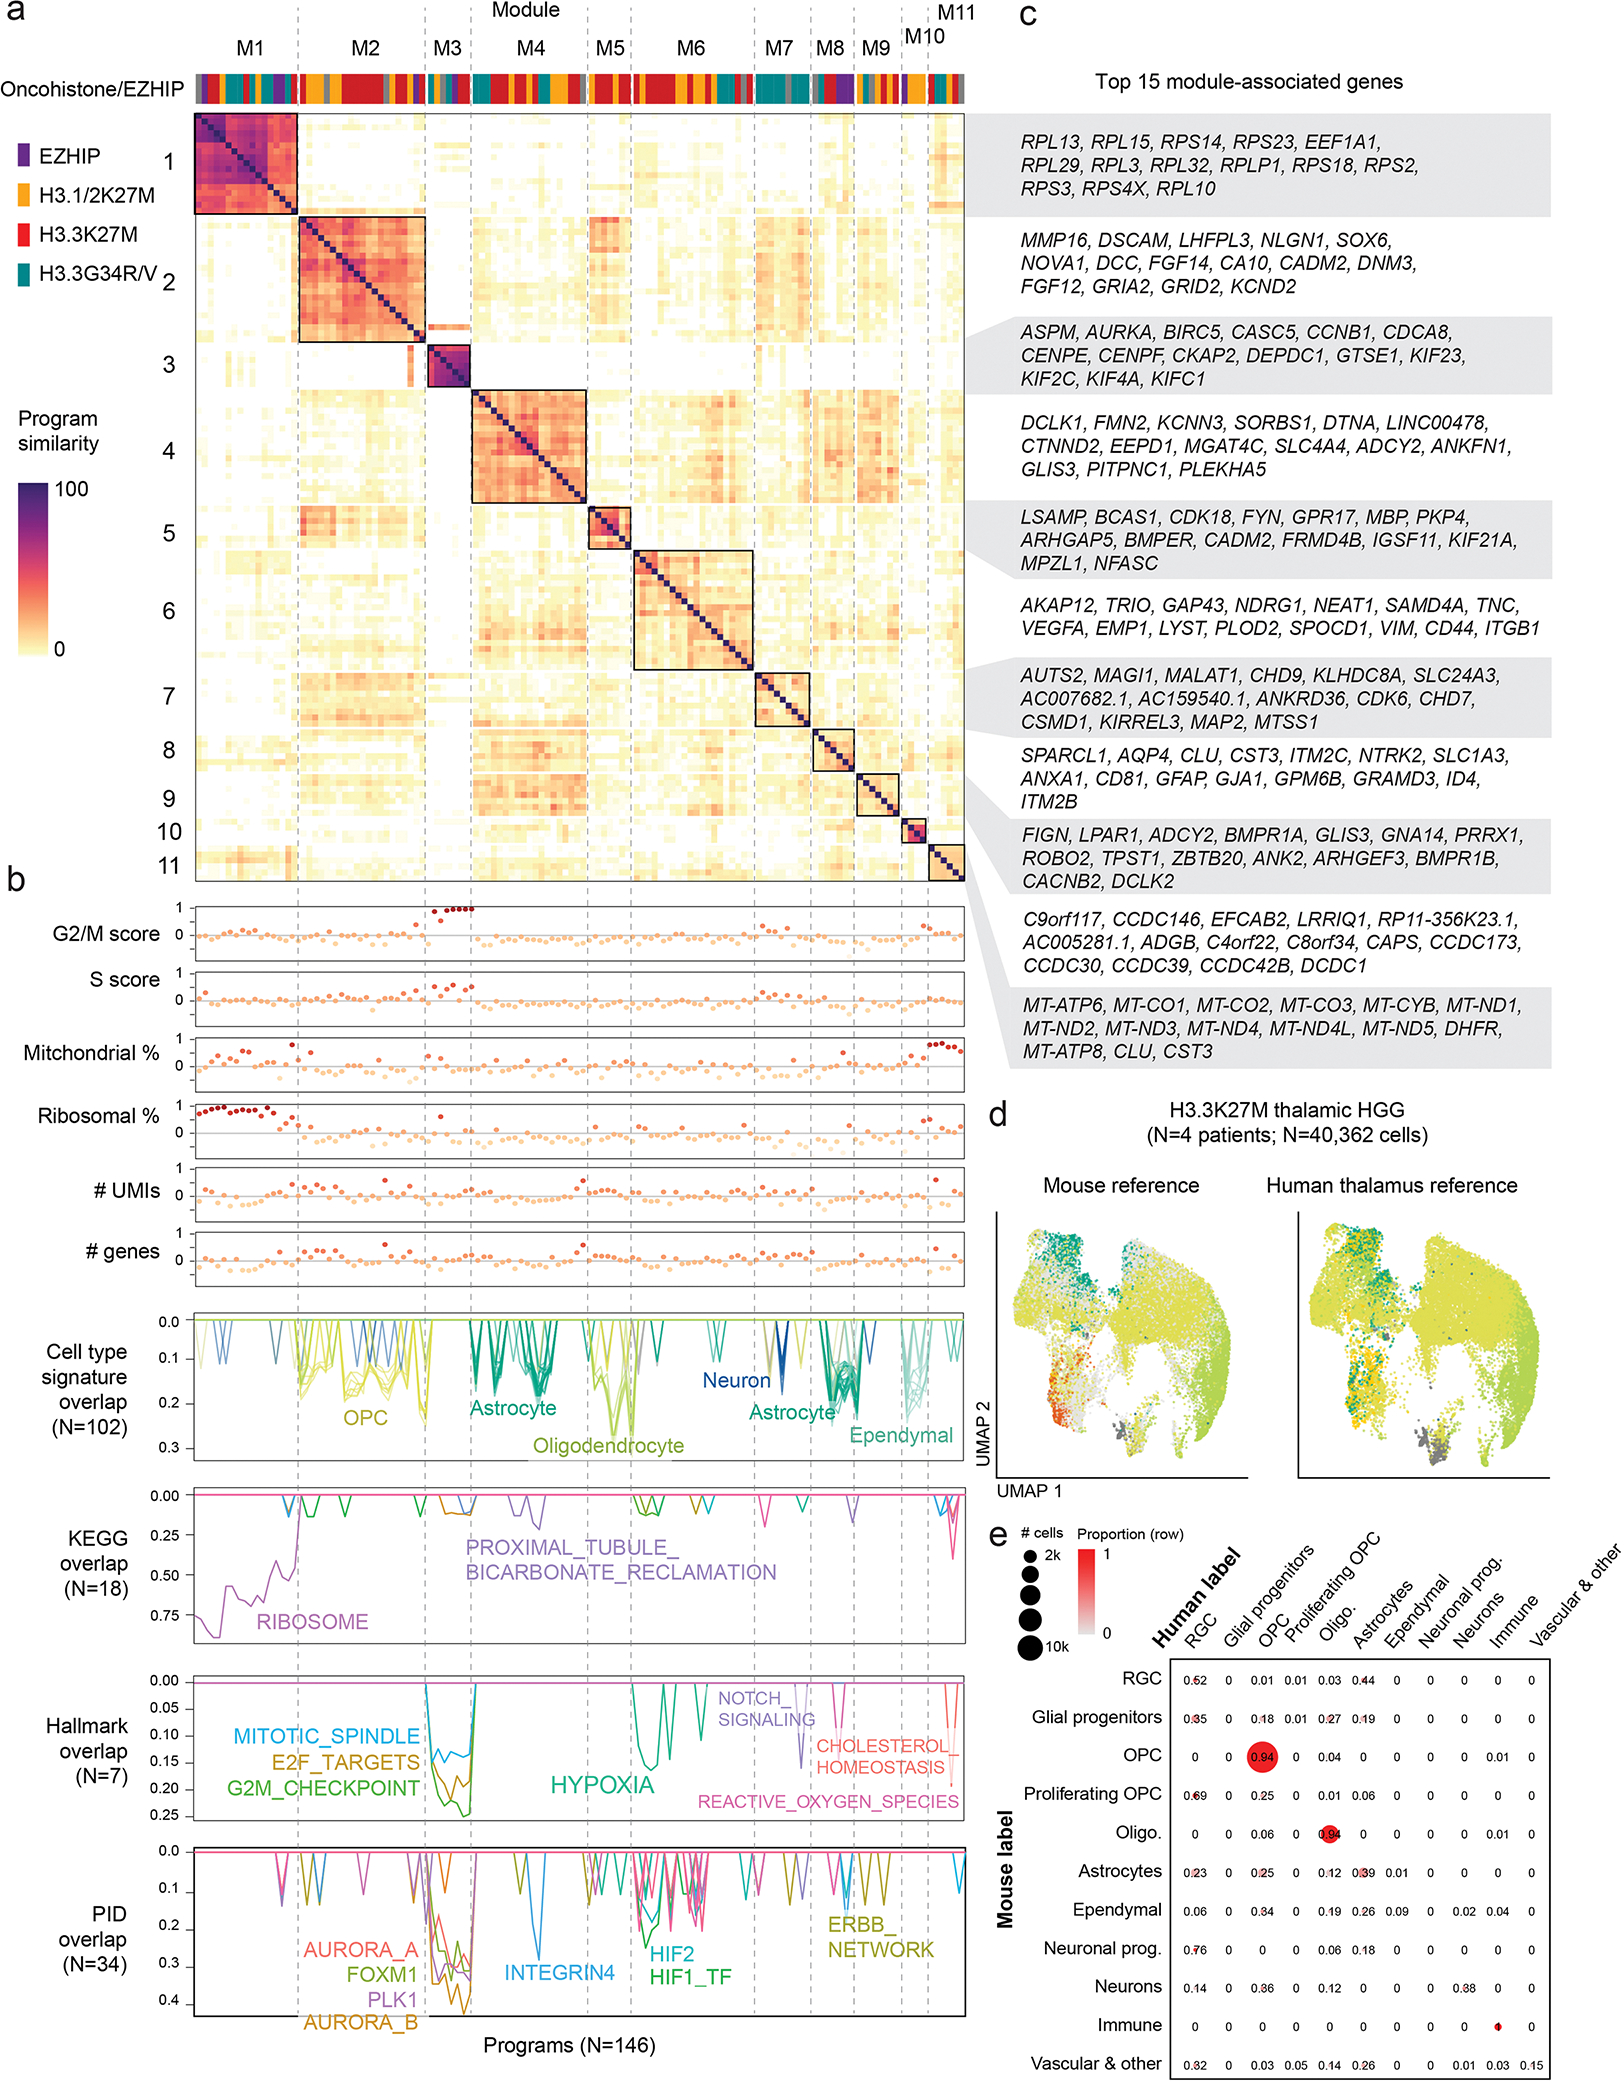
Extended Data Fig. 2. Unique cell type hierarchies in H3.1 and H3.3K27M HGGs.

a. Similarity matrix between all Non-negative Matrix Factorization (NMF) programs assigned to modules. Heatmap represents the pairwise overlap (in number of genes) between programs.
b. Annotation of NMF programs. Top: Correlation between each program and QC or biological metrics in each cell. One module (M11) that was explained by technical factors (mitochondrial content and coverage), was consequently removed from further analyses. Bottom: overlap between each program and developmental or MSigDB reference signatures, one line per signature. Only significant overlaps (p-value < 0.001) are shown, and number of significant overlaps is shown in parentheses.
c. Top 15 genes associated with each module. Module-associated genes were selected by identifying the most frequent program-associated genes for all programs contained in the module.
d. UMAP for H3.3K27M thalamic HGG (malignant cells only), with cells coloured by consensus projected cell type based on the normal mouse brain reference (left), or the normal human fetal thalamus reference (right). Cells are colored as in Figure 1d.
e. Confusion matrix comparing projected cell types for H3.3K27M thalamic HGG based on mouse or human reference. Proportions were computed row-wise and represent the fraction of cells from each mouse label which were assigned to each human label. Bubbles are scaled to the number of cells with each combination of labels.
