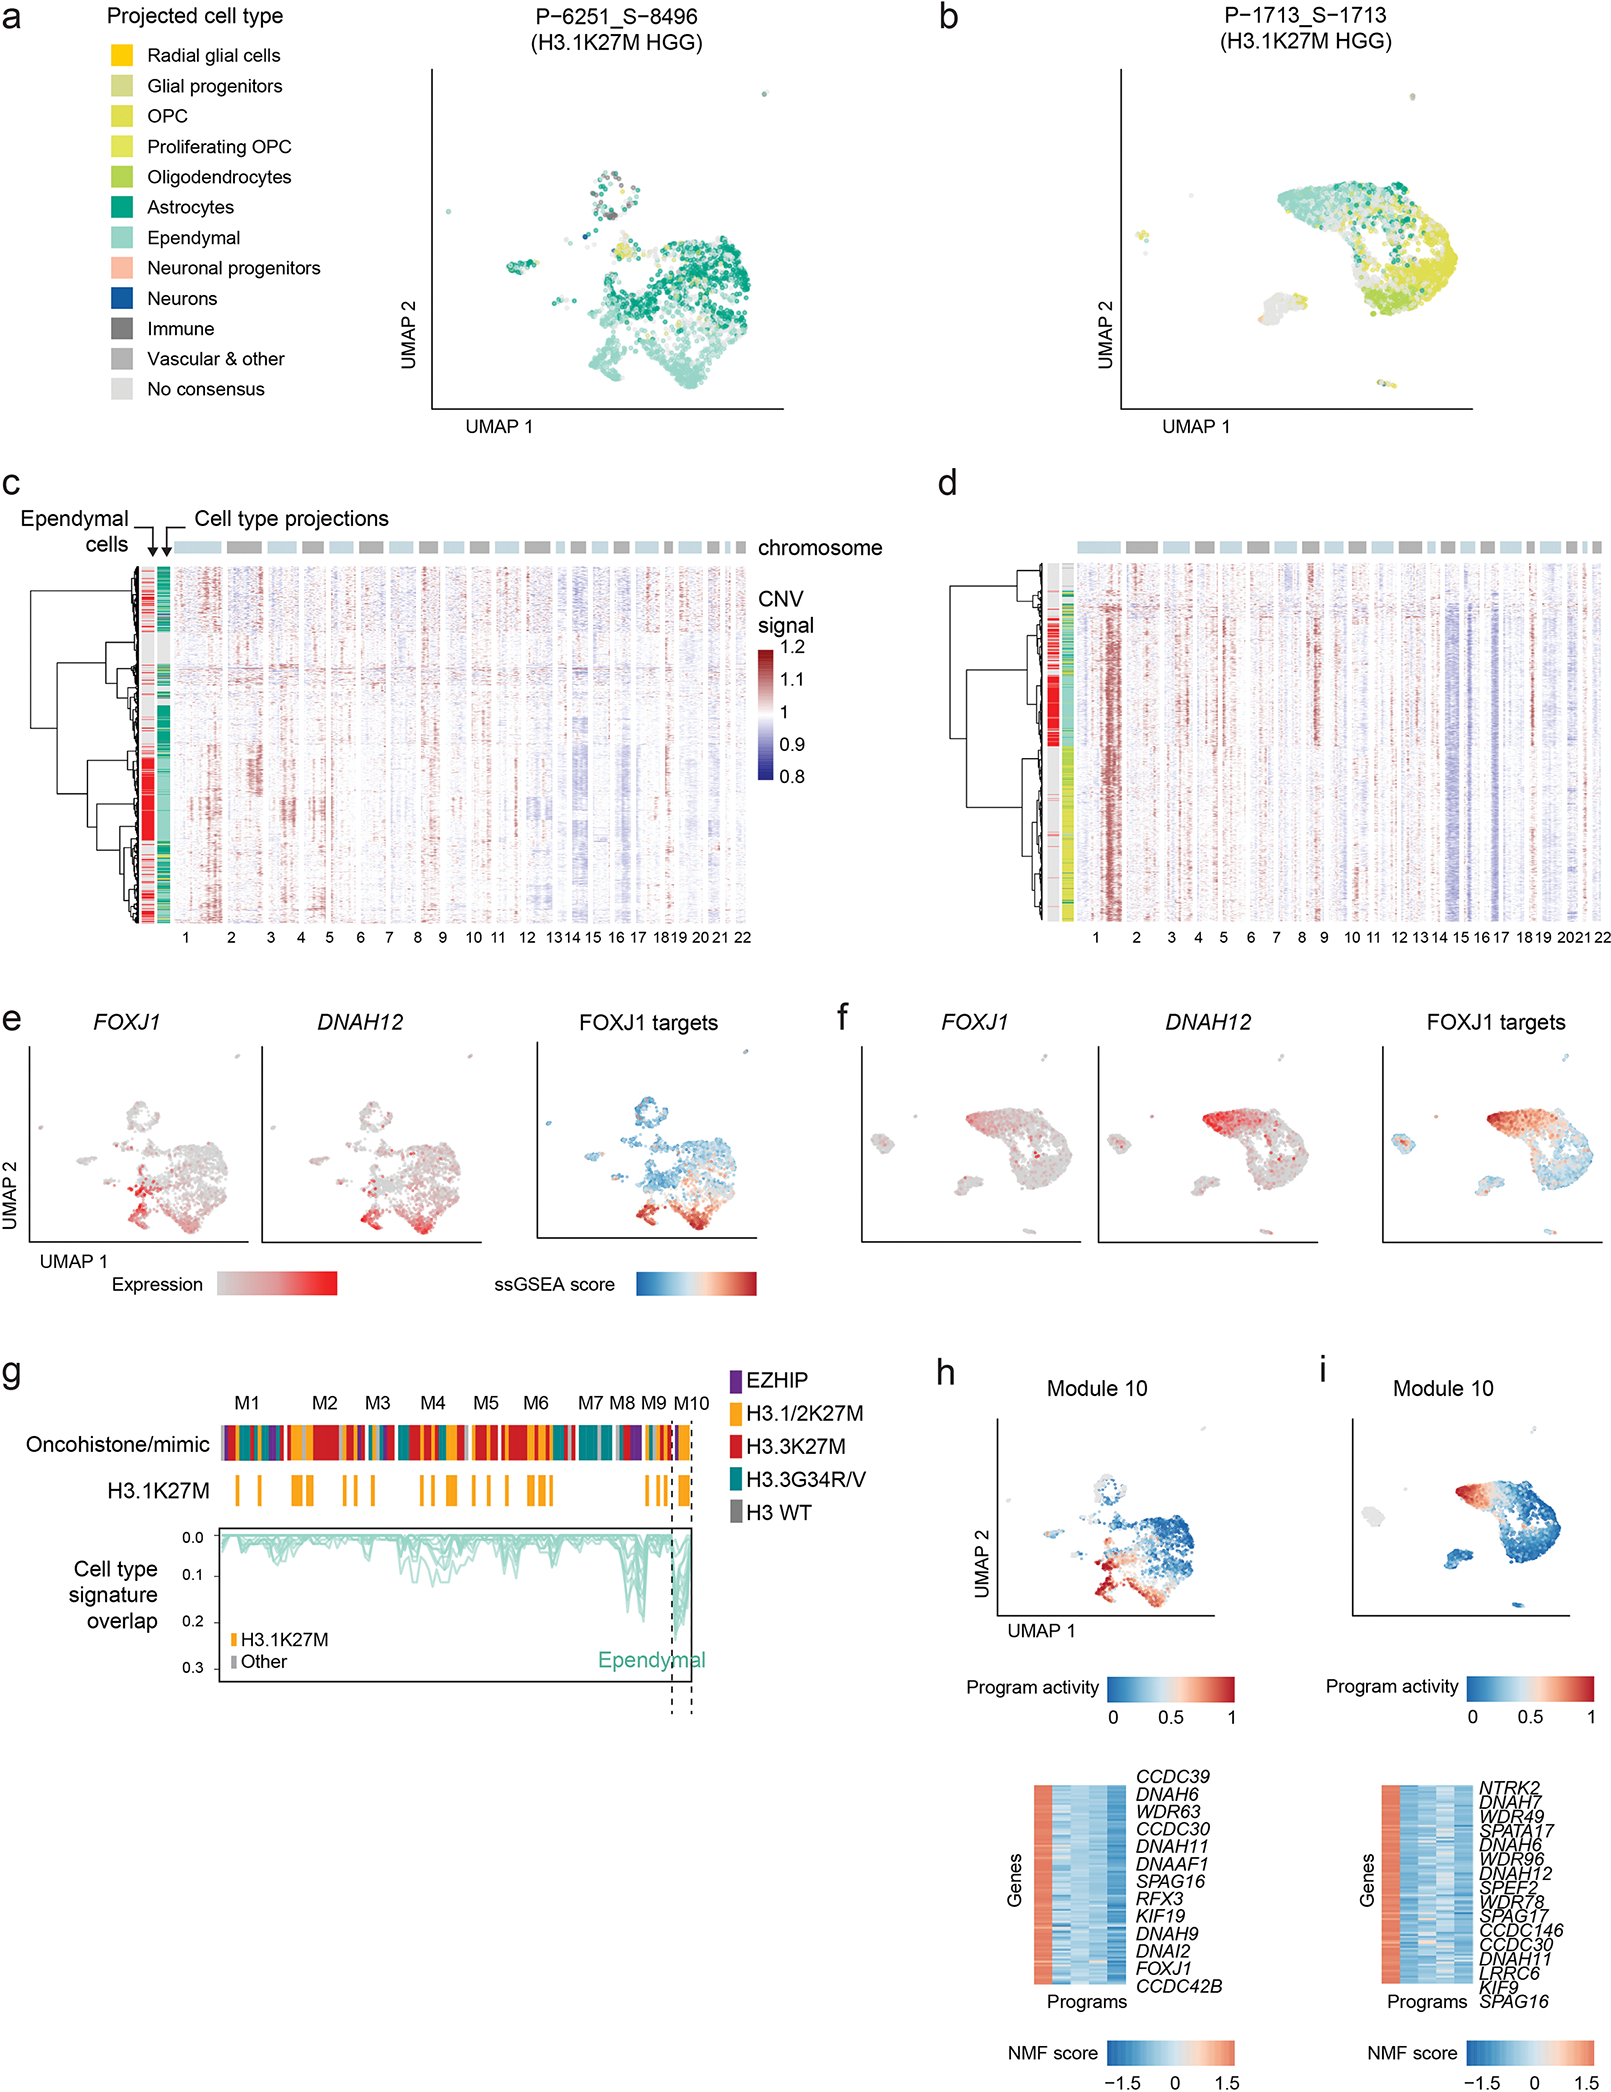
Extended Data Fig. 3. Some H3.1K27M pontine gliomas harbour a malignant ependymal-like component.

a-b. UMAP plots for two individual H3.1K27M pontine gliomas containing ependymal-like cells. Only malignant cells are shown. Cells are colored by consensus projected cell type.
c-d. Heatmaps of copy-number signal computed for each individual sample using InferCNV. Row annotations correspond to cell type projections, indicating whether they are projected to ependymal cells (left, red), and the overall projected cell class, with colors as in (a) and normal cells colored in gray. Cells lacking a consensus projection were excluded.
e-f. UMAP plots as in (a-b), with cells coloured by expression of FOXJ1 (ependymal transcription factor), DNAH12 (ciliary gene), and single-cell gene set enrichment (ssGSEA) score of candidate FOXJ1 targets in the early postnatal mouse brain. List of FOXJ1 targets was obtained from Jacquet et al, Development, 200944.
g. NMF programs from Figure 1c, displaying only the overlap between program-associated genes with ependymal gene signatures, and filtering out all other developmental signatures. Top column annotation shows the driver alteration of the sample in which each program was identified. A second annotation highlighting H3.1/2K27M tumors is included for clarity. Module 10, significantly overlapping ependymal signatures, is enriched for programs from this tumor entity.
h-i. Activity of the ependymal-related module 10 in individual samples. Top: UMAP plots as in (a-b), cells are coloured by the NMF activity score of the module 10 program from each sample. Bottom: heatmap of NMF score of module 10 program-associated genes; names for selected informative genes are indicated.
