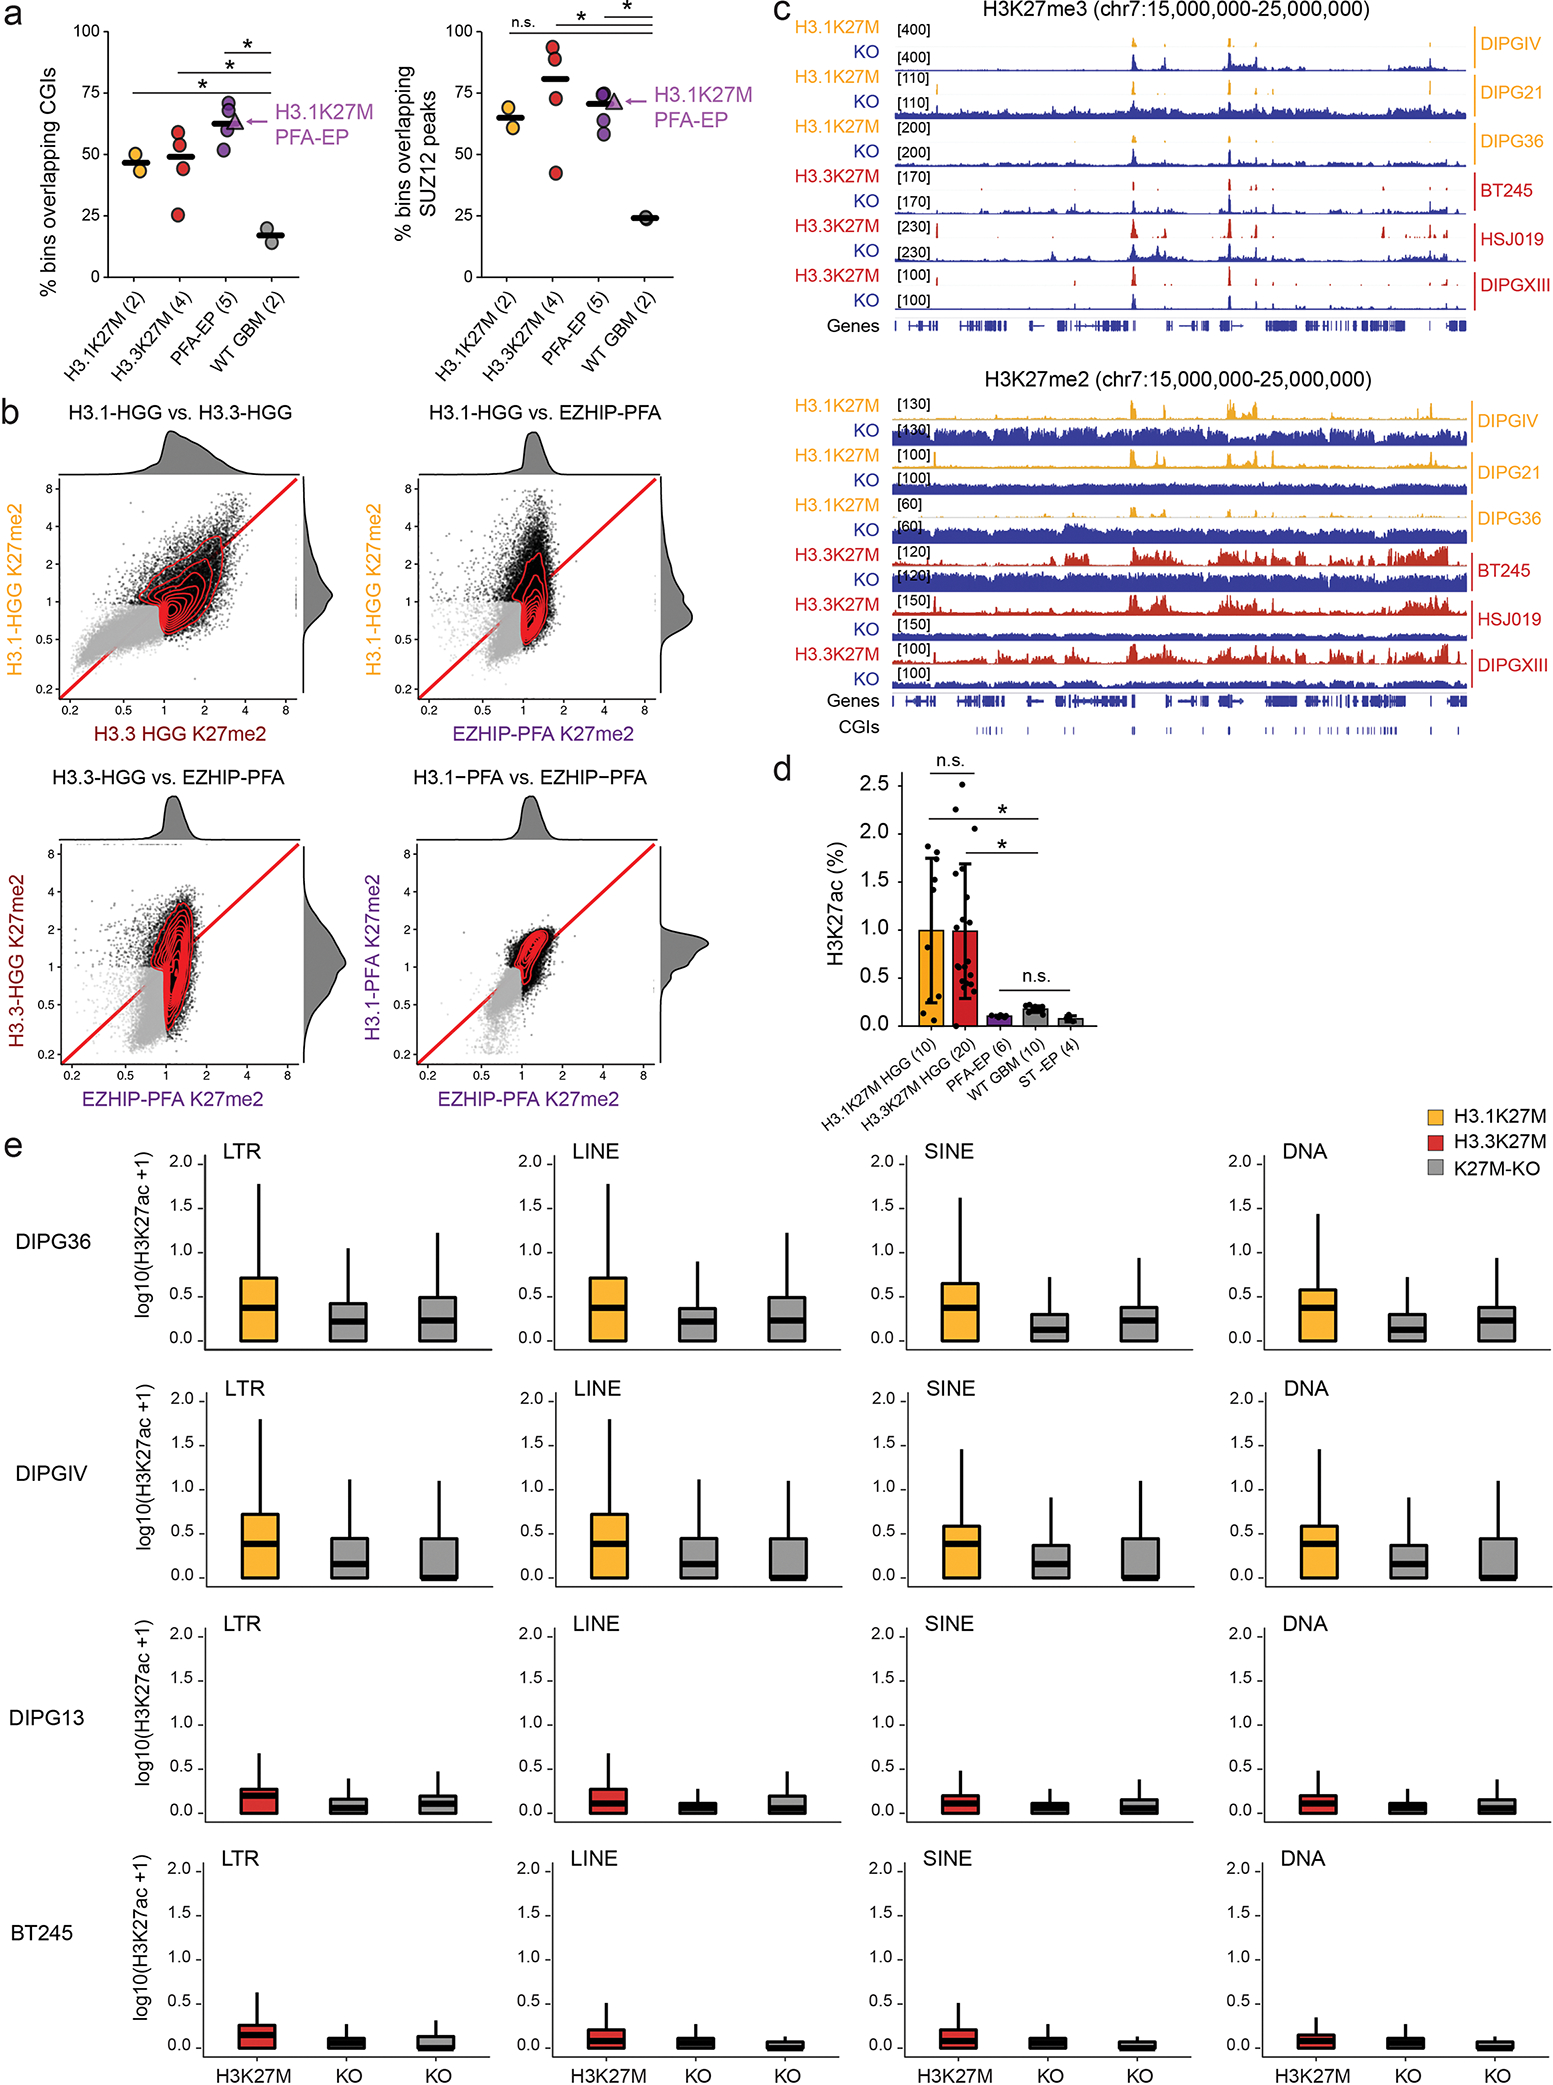
Extended Data Fig. 7. H3K27M and EZHIP converge to restrict H3K27me3 to PRC2 nucleation sites.

a. Percentage of H3K27me3-marked 10kb bins overlapping CGIs or SUZ12 peaks in cell lines and tumors. Number of biologically independent samples per group is indicated in parentheses. H3K27me3 was quantified in 10kb bins genome-wide and the top 1% bins with highest H3K27me3 in each sample were intersected with CGIs/SUZ12 peaks. For SUZ12, the union of peaks called from SUZ12 ChIPseq in BT245 and DIPGXIII were obtained from Harutyunyan et al, Nature Communications, 201938. Crossbar indicates the median. P-values: left panel (H3.1K27M vs WT GBM, p = 0.024; H3.3K27M vs WT GBM, p = 0.026; PFA-EP vs WT GBM, 0.00099); right panel (H3.1K27M vs WT GBM, p = 0.063; H3.3K27M vs WT GBM, p = 0.023; PFA-EP vs WT GBM, p = 0.0016); n.s., not significant; Welch two-sample t-test.
b. Scatterplots of H3K27me2 signal over 100kb bins genome-wide in pairwise group comparisons. X- and Y- axes represent log2 mean RPKM value per group, normalized by input. Marked bins (mean RPKM > 1 in at least one of the groups in each comparison) are shown in black, while unmarked bins are shown in gray. Joint density and marginal distributions are calculated over marked bins only. Red line indicates the diagonal. RPKM values of H3K27me2 were divided by the respective input sample RPKM and averaged for all samples in the same mutation group using a geometric mean.
c. H3K27me3 (top) and H3K27me2 (bottom) ChIP-seq enrichment tracks, in representative K27M-mutant and isogenic CRISPR-KO cell lines.
d. Mass spectrometry data of H3K27ac in cell. Number of biologically independent samples per group is indicated in parentheses. Error bars represent mean +/− SD. P-values: H3.1K27M vs WT GBM, 0.0074; H3.3K27M vs WT GBM: 5.3×10⁻⁵; n.s., not significant; Welch two-sample t-test.
e. Enrichment of H3K27ac over different repeat element families in HGG cell lines and isogenic K27M-KO counterparts.
