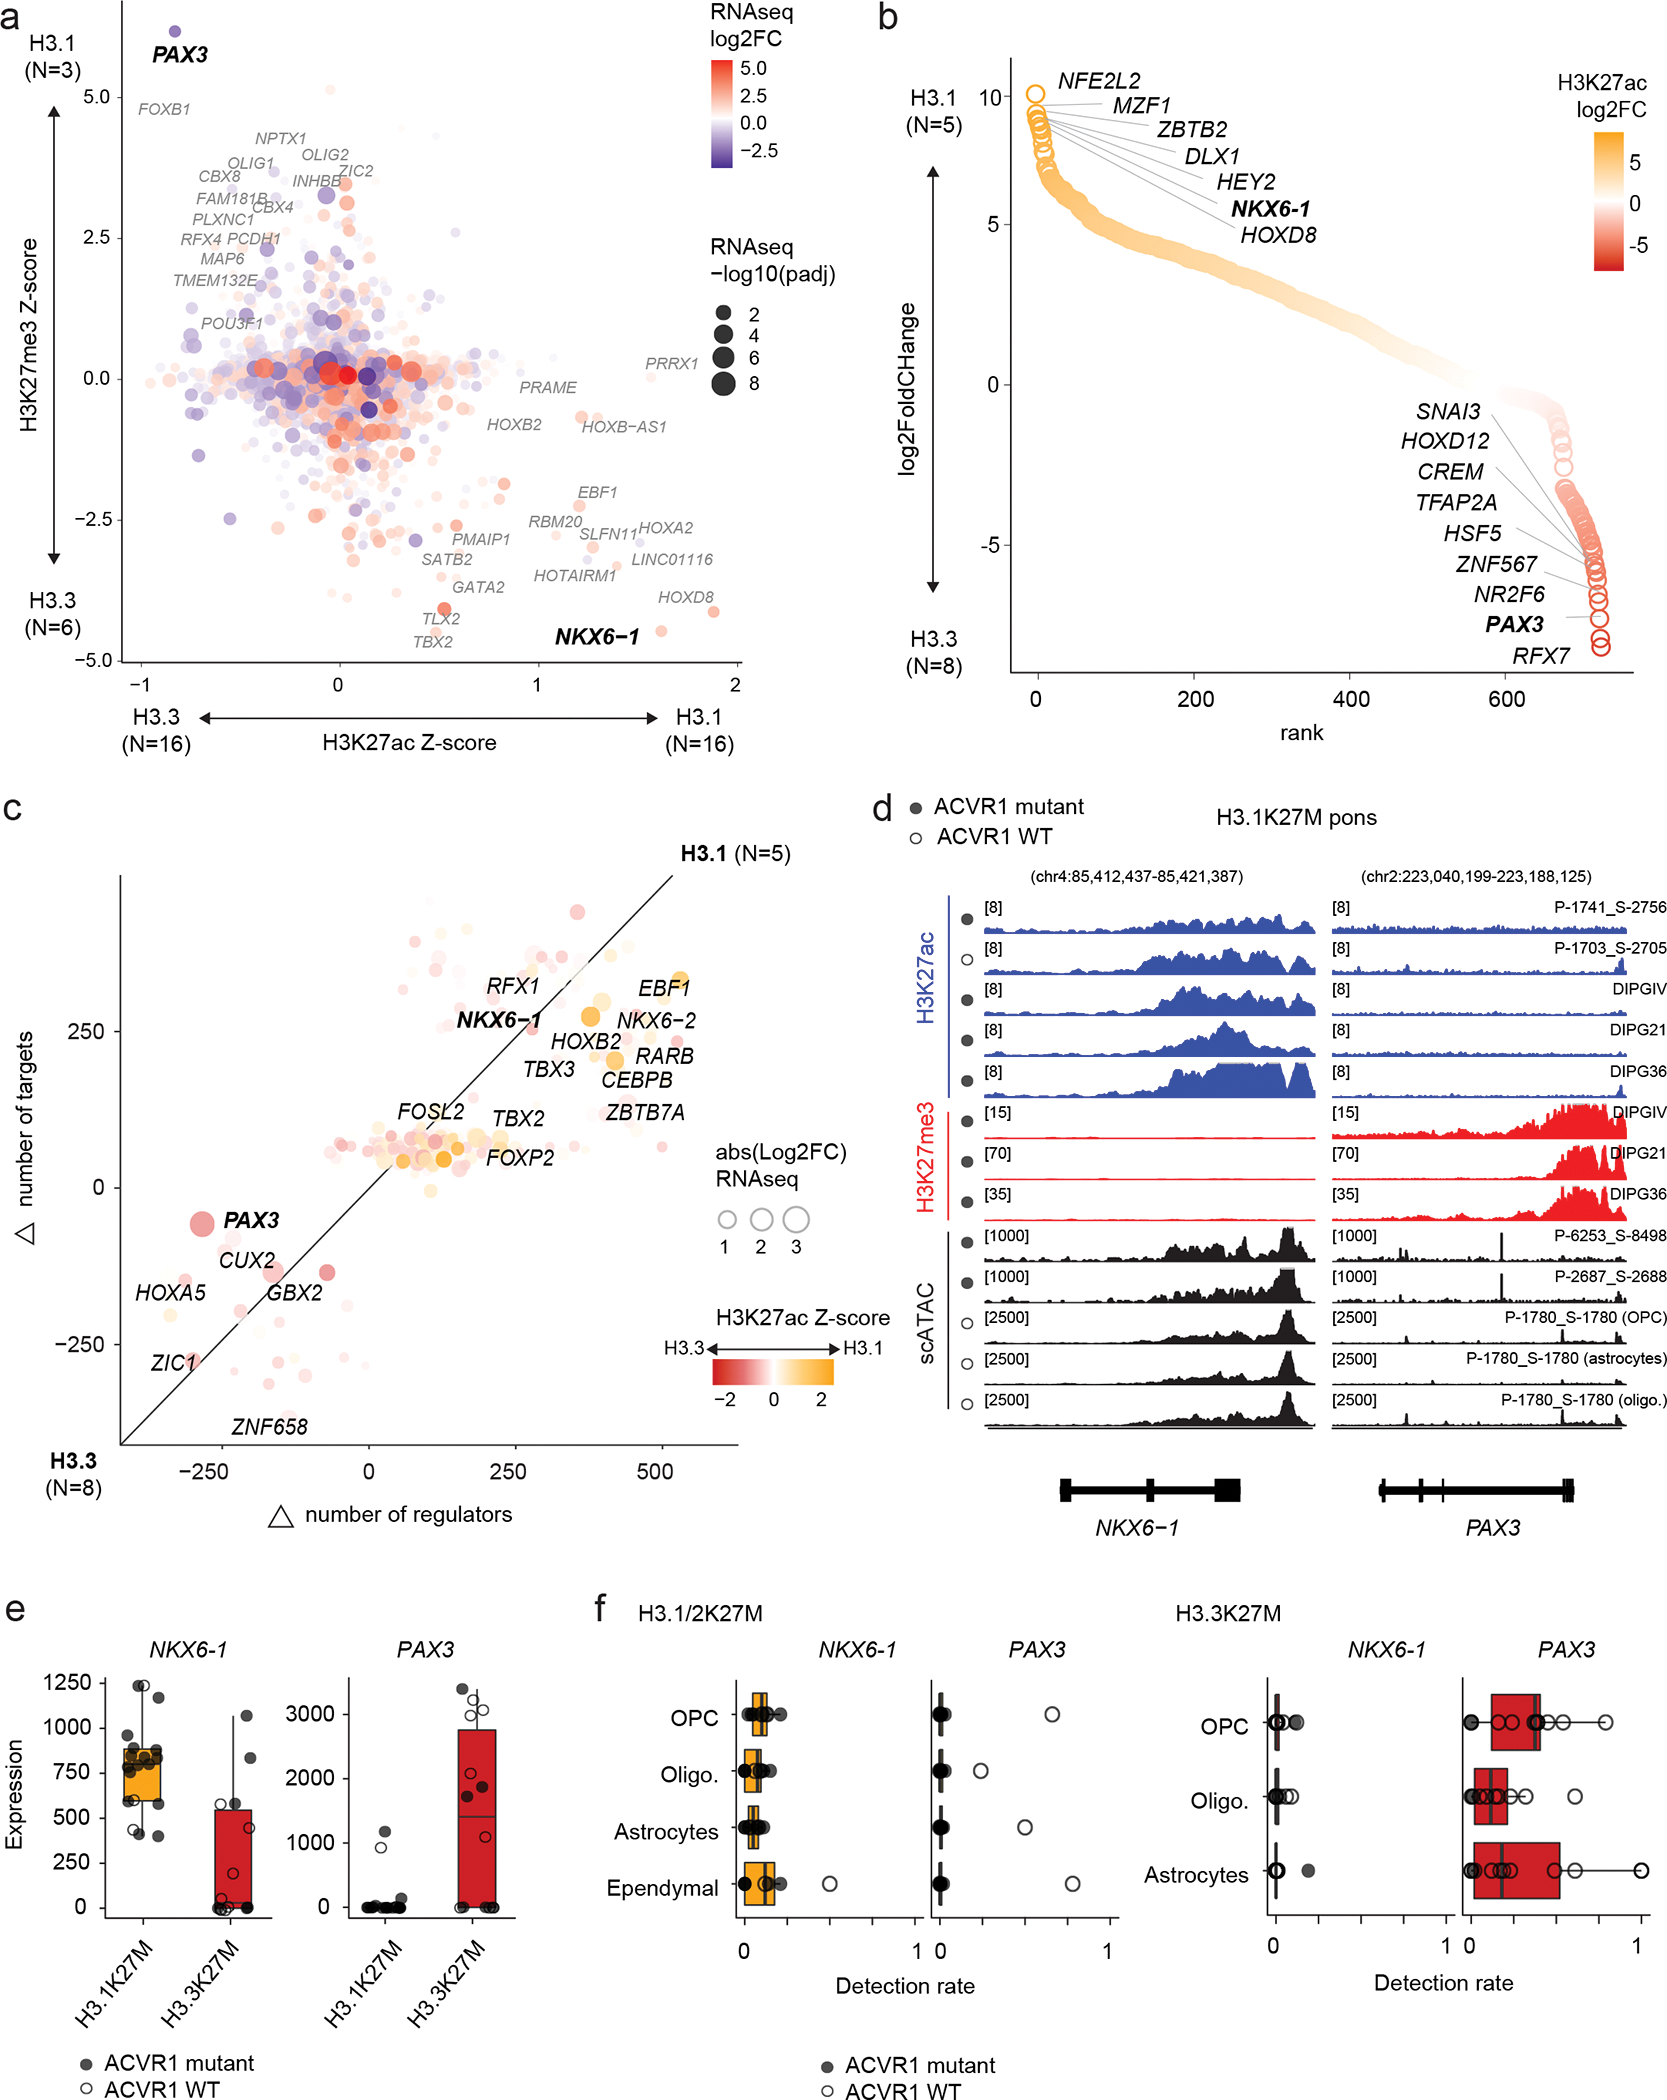
Figure 4. H3.1K27M ACVR1-mutant gliomas mirror a SHH-specified NKX6-1+ progenitor.

a. Promoter-associated H3K27ac and H3K27me3 over all expressed genes. Axes represent enrichment of each mark in H3.1K27M pons vs H3.3K27M pons HGG (Z-score, see Methods and Data Availability). Log2FC: log2 fold-change; padj: adjusted p-value (negative binomial Wald test, Benjamini-Hochberg correction).
b. Differential enhancer analysis, based on H3K27ac peaks, between H3.1 and H3.3K27M pons HGG. Enhancers are ranked by log2 fold-change of H3K27ac as in (a).
c. Differences in core regulatory circuitry (CRC) between H3.1K27M pons and H3.3K27M pons HGG. X-axis represents differences in number of genes regulating each transcription factor (TF), and y-axis represents differences in number of targets of each TF.
d. Epigenomic state at NKX6-1 and PAX3 in representative H3.1K27M pons tumors and cell lines. For scATACseq data, each track represents RPKM-normalized aggregated accessibility for one malignant single-cell population. Y-axis limits are indicated in brackets.
e. Bulk RNAseq expression levels of NKX6-1 and PAX3 for all pons tumors, by histone 3 variant (H3.1K27M, N=19 patients; H3.3K27M, N=14).
f. Detection levels of NKX6-1 and PAX3 in malignant cells for all pons tumors in the scRNAseq cohort, stratified by projected cell type, for each histone 3 variant (H3.1K27M, N=8 patients; H3.3K27M, N=16). Cells without a consensus projection and cell types comprising less than 5% of the dataset for each tumor type were excluded.
