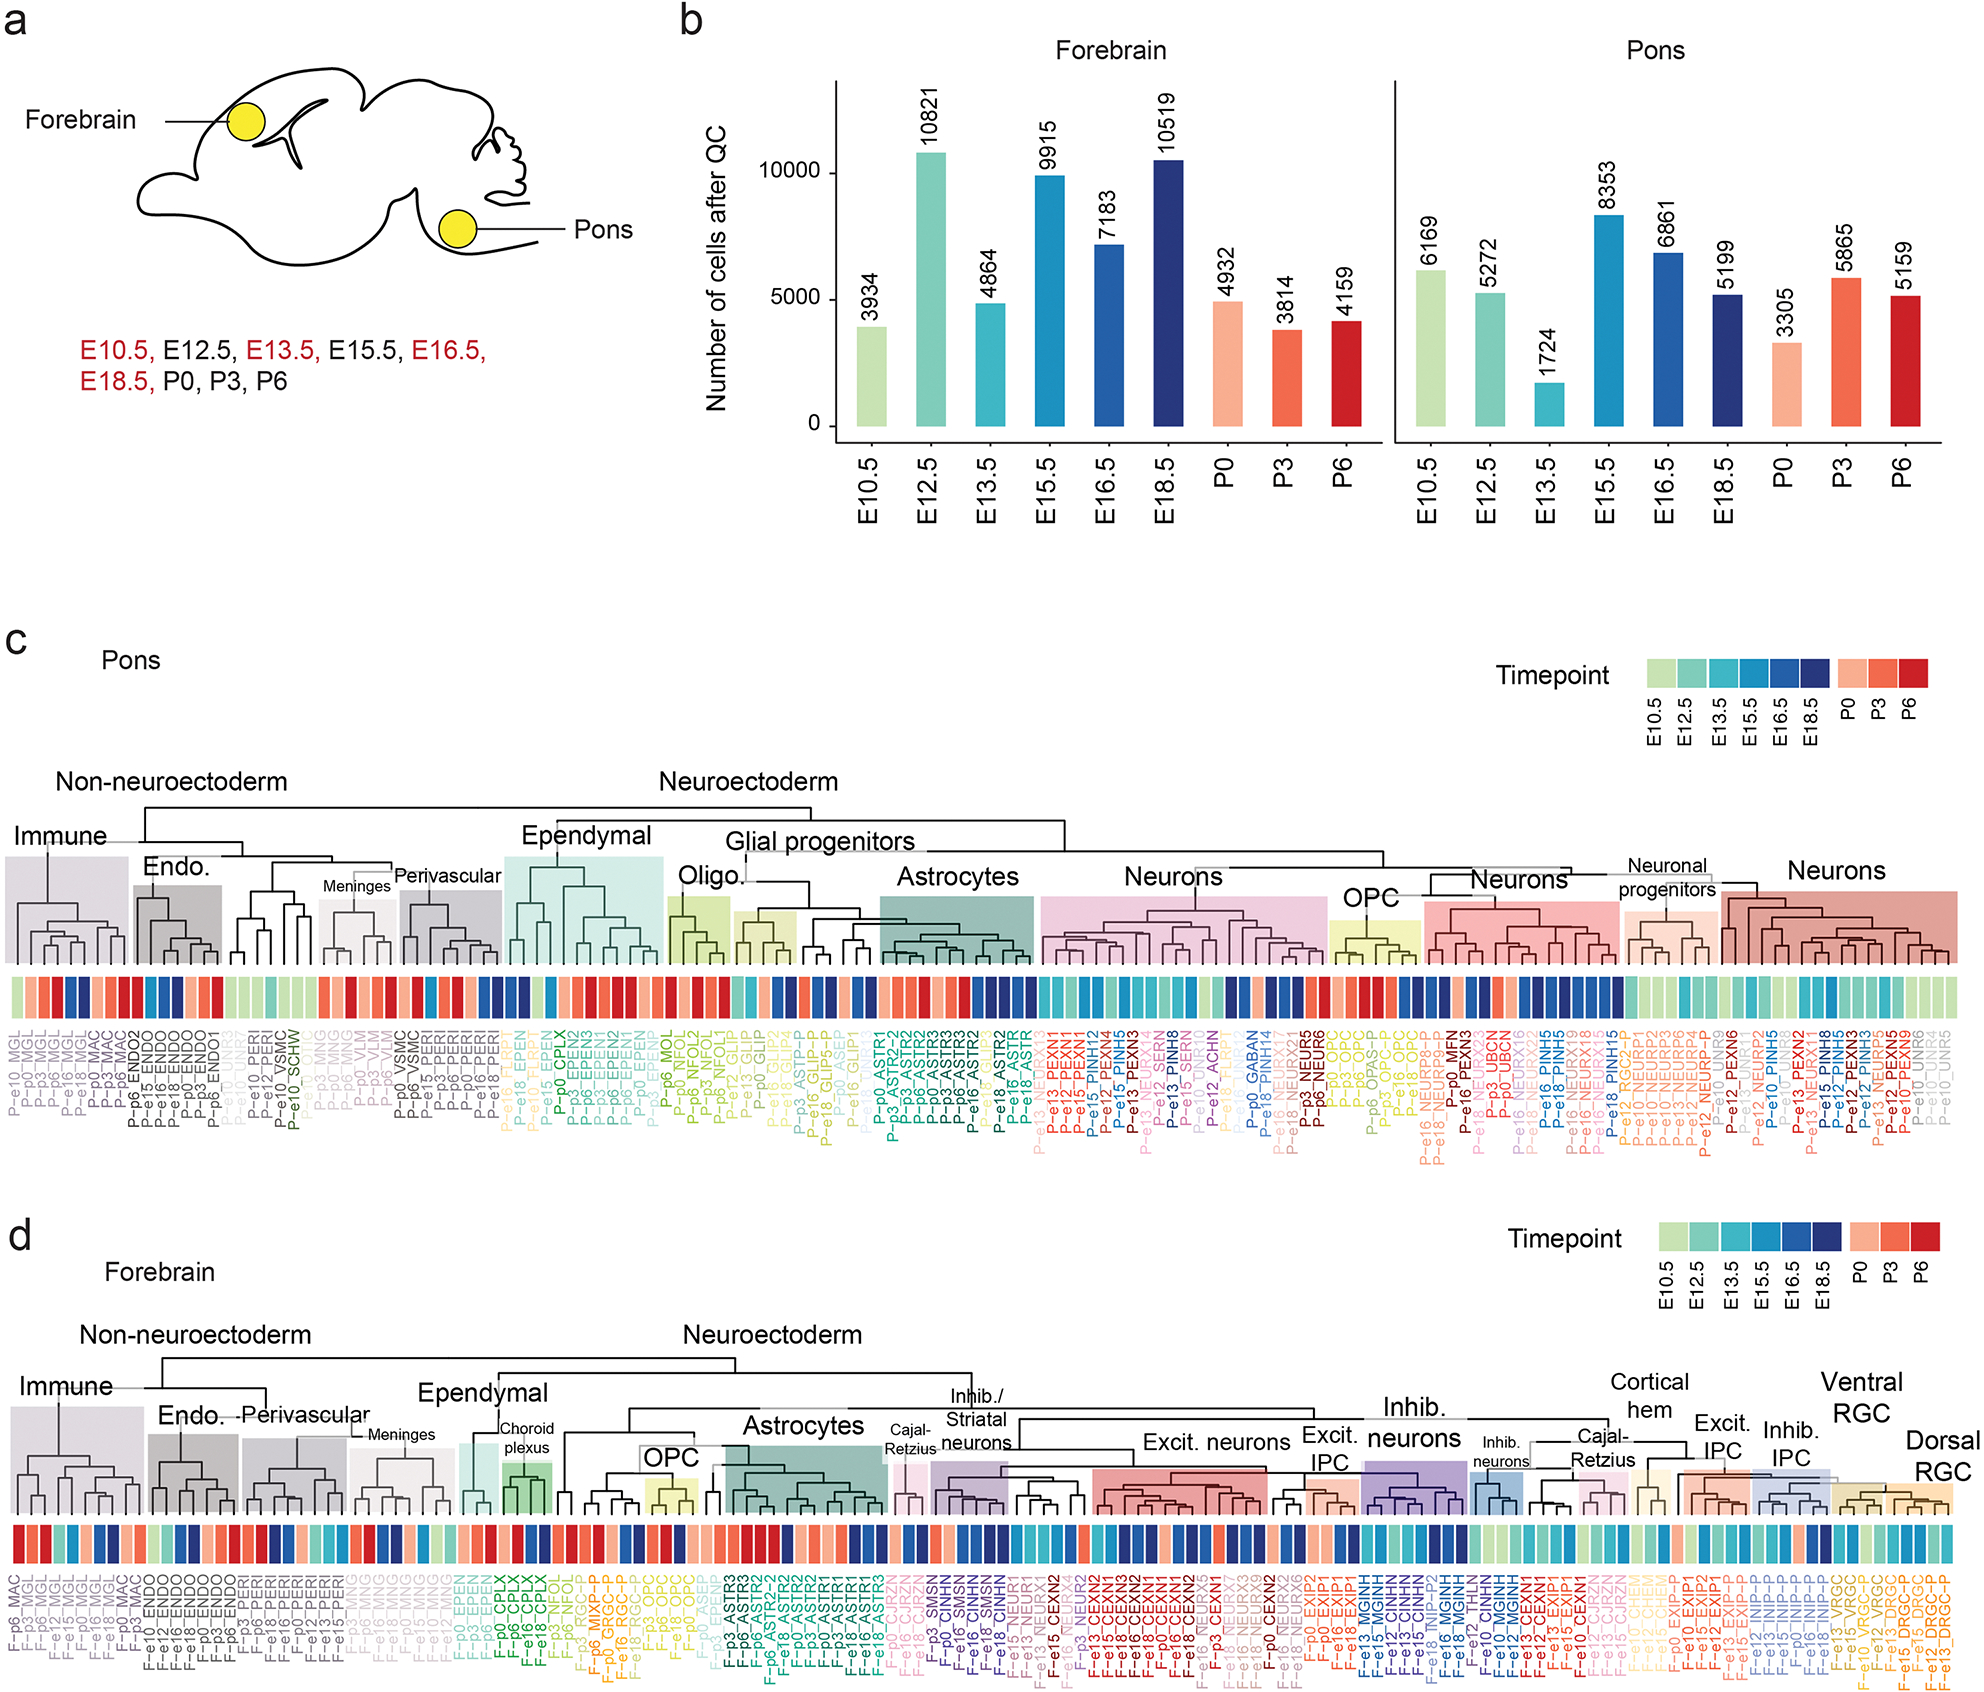
Extended Data Fig. 1. Overview of expanded scRNAseq mouse developmental reference.

a. Schematic of developing mouse brain, sagittal view, indicating regions and timepoints included in the single-cell reference atlas. Red: data generated in this study; black: data from Jessa et al, Nature Genetics, 201934.
b. Number of cells captured in each time point and brain region after quality control and filtering.
c. Overview of single-cell populations from the mouse pons. Dendrogram constructed based on pairwise Spearman correlations between mean expression profiles in each cluster. Cell class and time point are annotated.
d. Overview of single-cell populations from the mouse forebrain. Dendrogram constructed based on pairwise Spearman correlations between mean expression profiles in each cluster. Cell class and time point are annotated.
