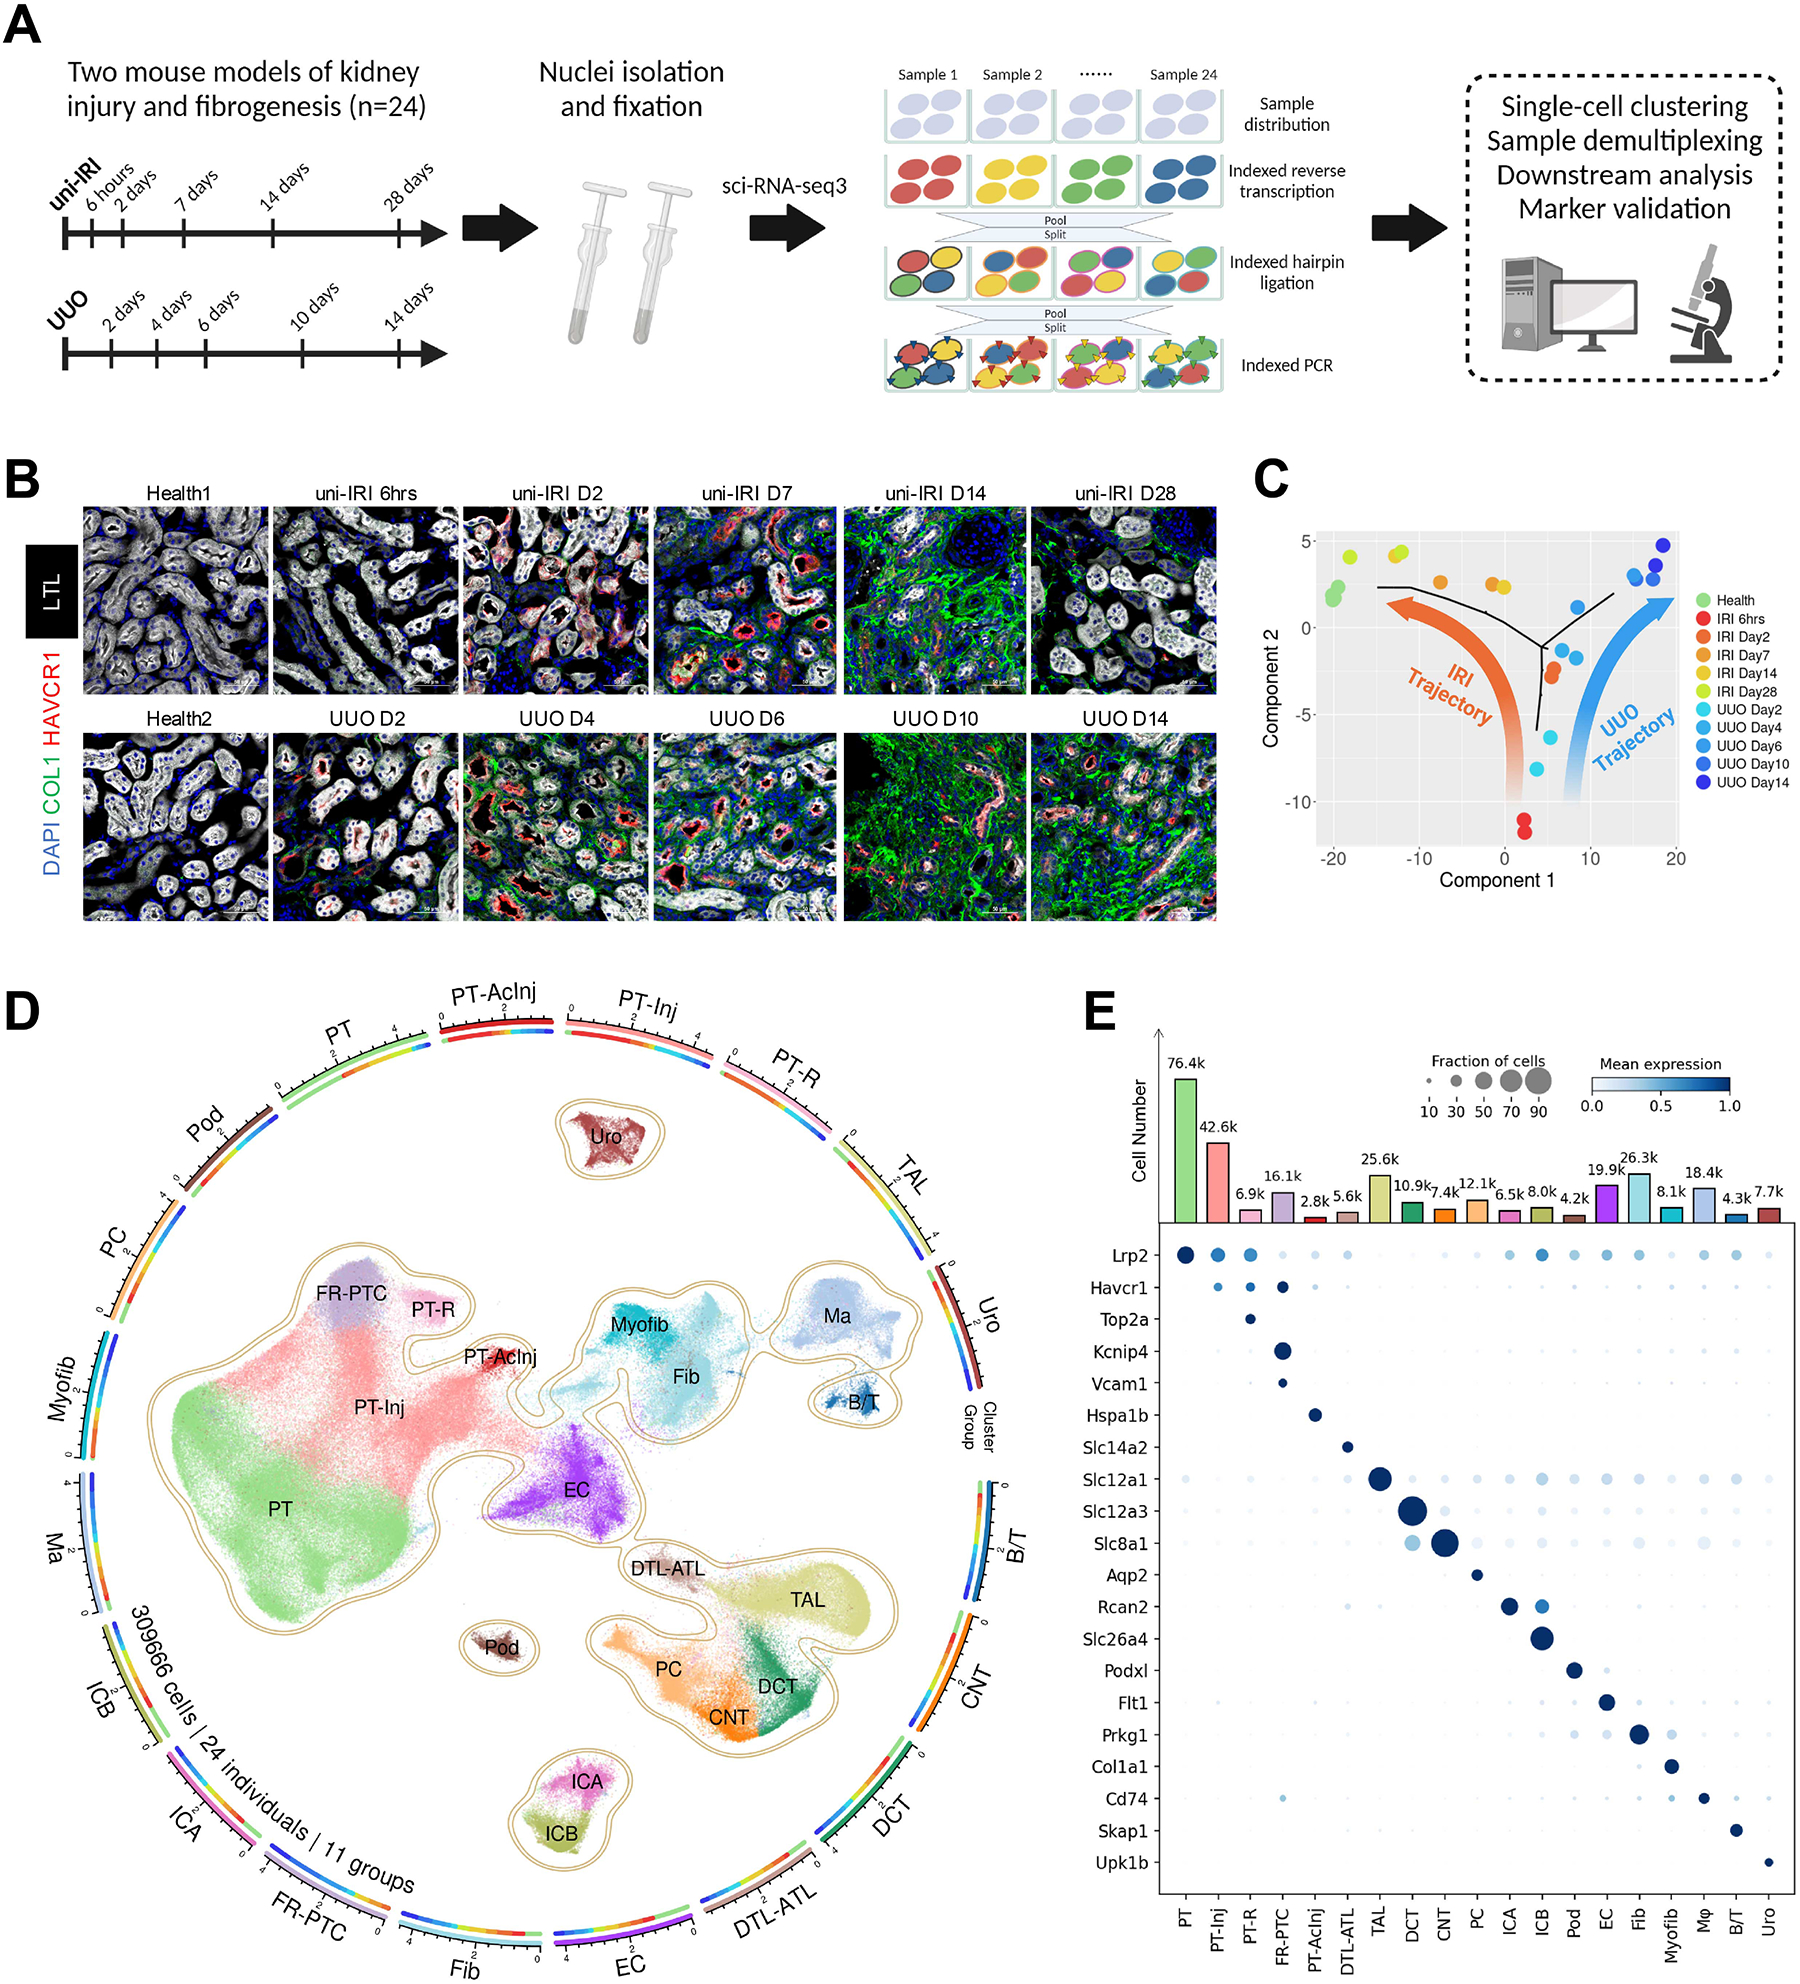
Figure 1. A single-cell transcriptomics landscape of mouse kidney fibrogenesis profiled with sci-RNA-seq3.

(A) Summary of experimental methodology. n = 2 per timepoint. Nuclei were extracted from all kidney samples and profiled with a three-level combinatorial indexing sequencing strategy. Cells were demultiplexed based on 1st indexing barcodes to identify sample origins in data analysis. Figure created with BioRender.com.
(B) Immunofluorescence staining of HAVCR1 (red), Collagen Type I (green), Lotus Tetragonolobus Lectin (LTL; white) and DAPI (blue) on tissue sections collected from all healthy and diseased conditions of our study cohort. Scale bar: 50 μm.
(C) Pseudobulk trajectory projection (using Monocle2) of all sample conditions in the study cohort revealing distinct transcriptomic signature of uni-IRI and UUO. Each dot represents a sample (n = 24 in total).
(D) An atlas of mouse kidney fibrogenesis. A UMAP presentation (center) shows 309,666 cells profiled from 24 individual mouse kidneys of 11 healthy or diseased conditions. The surrounding circular layouts indicate the cell number of each population (log10-transformed scale bar), 19 major cell types (outer layout) and distributions of 11 group conditions in each cell type (inner layout; color legend same as Figure 1C). PT, proximal tubule; PT-Inj, injured PT; PT-R, repairing PT; FR-PTC, failed repair PT cells; PT-AcInj, acute injury PT; DTL, descending limb of loop of Henle (LoH); ATL, thin ascending limb of LoH; TAL, thick ascending limb of LoH; DCT, distal convoluted tubule; CNT, connecting tubule; PC, principal cell of collecting duct; ICA, type A intercalated cell of collecting duct; ICB, type B intercalated cell of collecting duct; Pod, podocyte; EC, endothelial cell; Fib, fibroblast; Myofib, myofibroblast; Ma, macrophage (Mφ); B/T, immune cell; Uro, urothelium.
(E) Dot plot showing expression pattern of cluster-specific marker genes and bar plot showing the number of cells of each cluster. In the dot plot, the diameter of the dot corresponds to the proportion of cells expressing the indicated gene and the density of the dot corresponds to average expression relative to all cell types.
