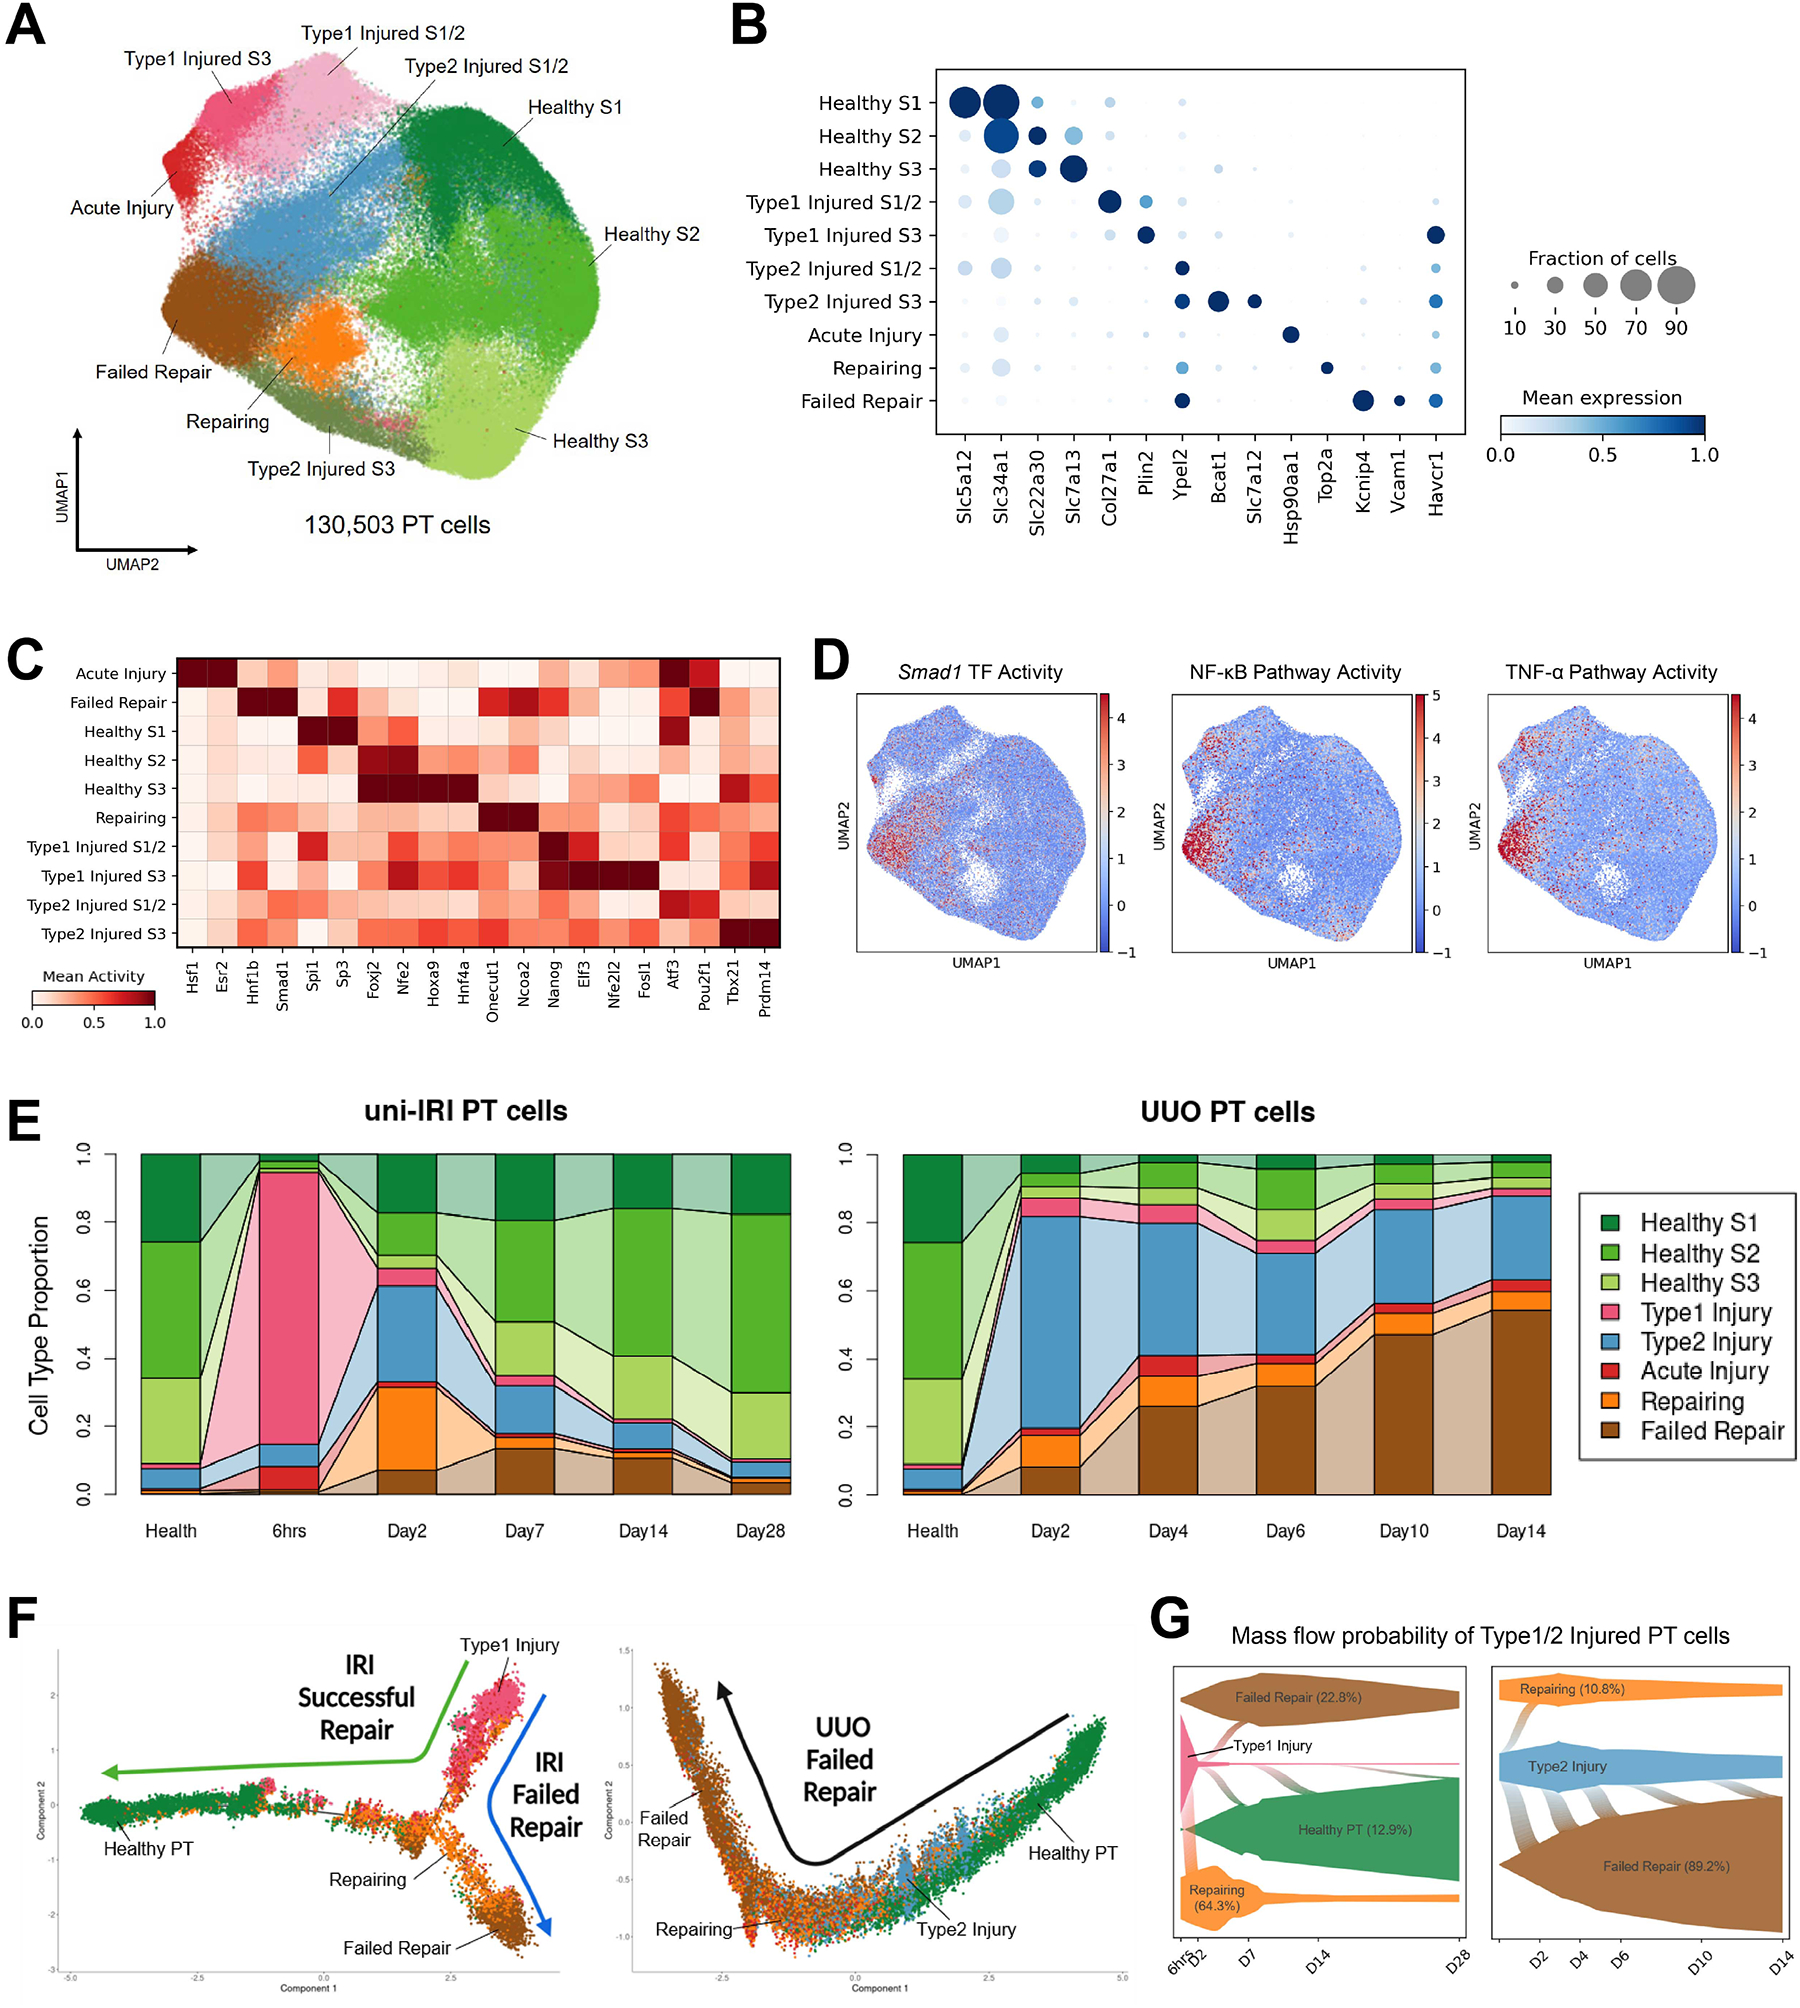
Figure 2. Diverse cell states of injured proximal tubule.

(A) UMAP plot of all PT cells after quality control in subclustering analysis. S1, S2 and S3 indicate the three anatomical segments of PT.
(B) Dot plot showing expression of marker genes of each PT cell clusters, including 3 clusters in healthy states and 7 injured cell states expressing Havcr1.
(C) Heat map showing cluster-specific transcription factor activity predicted by gene regulatory network analysis. Color density corresponds to average activity of the indicated gene relative to all PT cells.
(D) Transcription factor activity and single-cell pathway analysis showing activities of Smad1 and NF-κB/TNF-α pathways are enriched in the FR-PTC cluster.
(E) Connected bar plots displaying the proportional abundance of each cell cluster in each disease condition. Injured S1/2 and S3 cells are combined for the convenience of data visualization.
(F) Pseudotemporal ordering of cells sampled from uni-IRI and UUO subsets colored by cluster identity (color legend same as Figure 2E), using Monocle2.
(G) Single-cell fate mapping of Type1 and Type2 injured PT cells (color legend same as Figure 2E), using CellRank. Flows connecting two cell types describe lineage transition and the flow width indicate predicted probability. See also Figure S2K.
