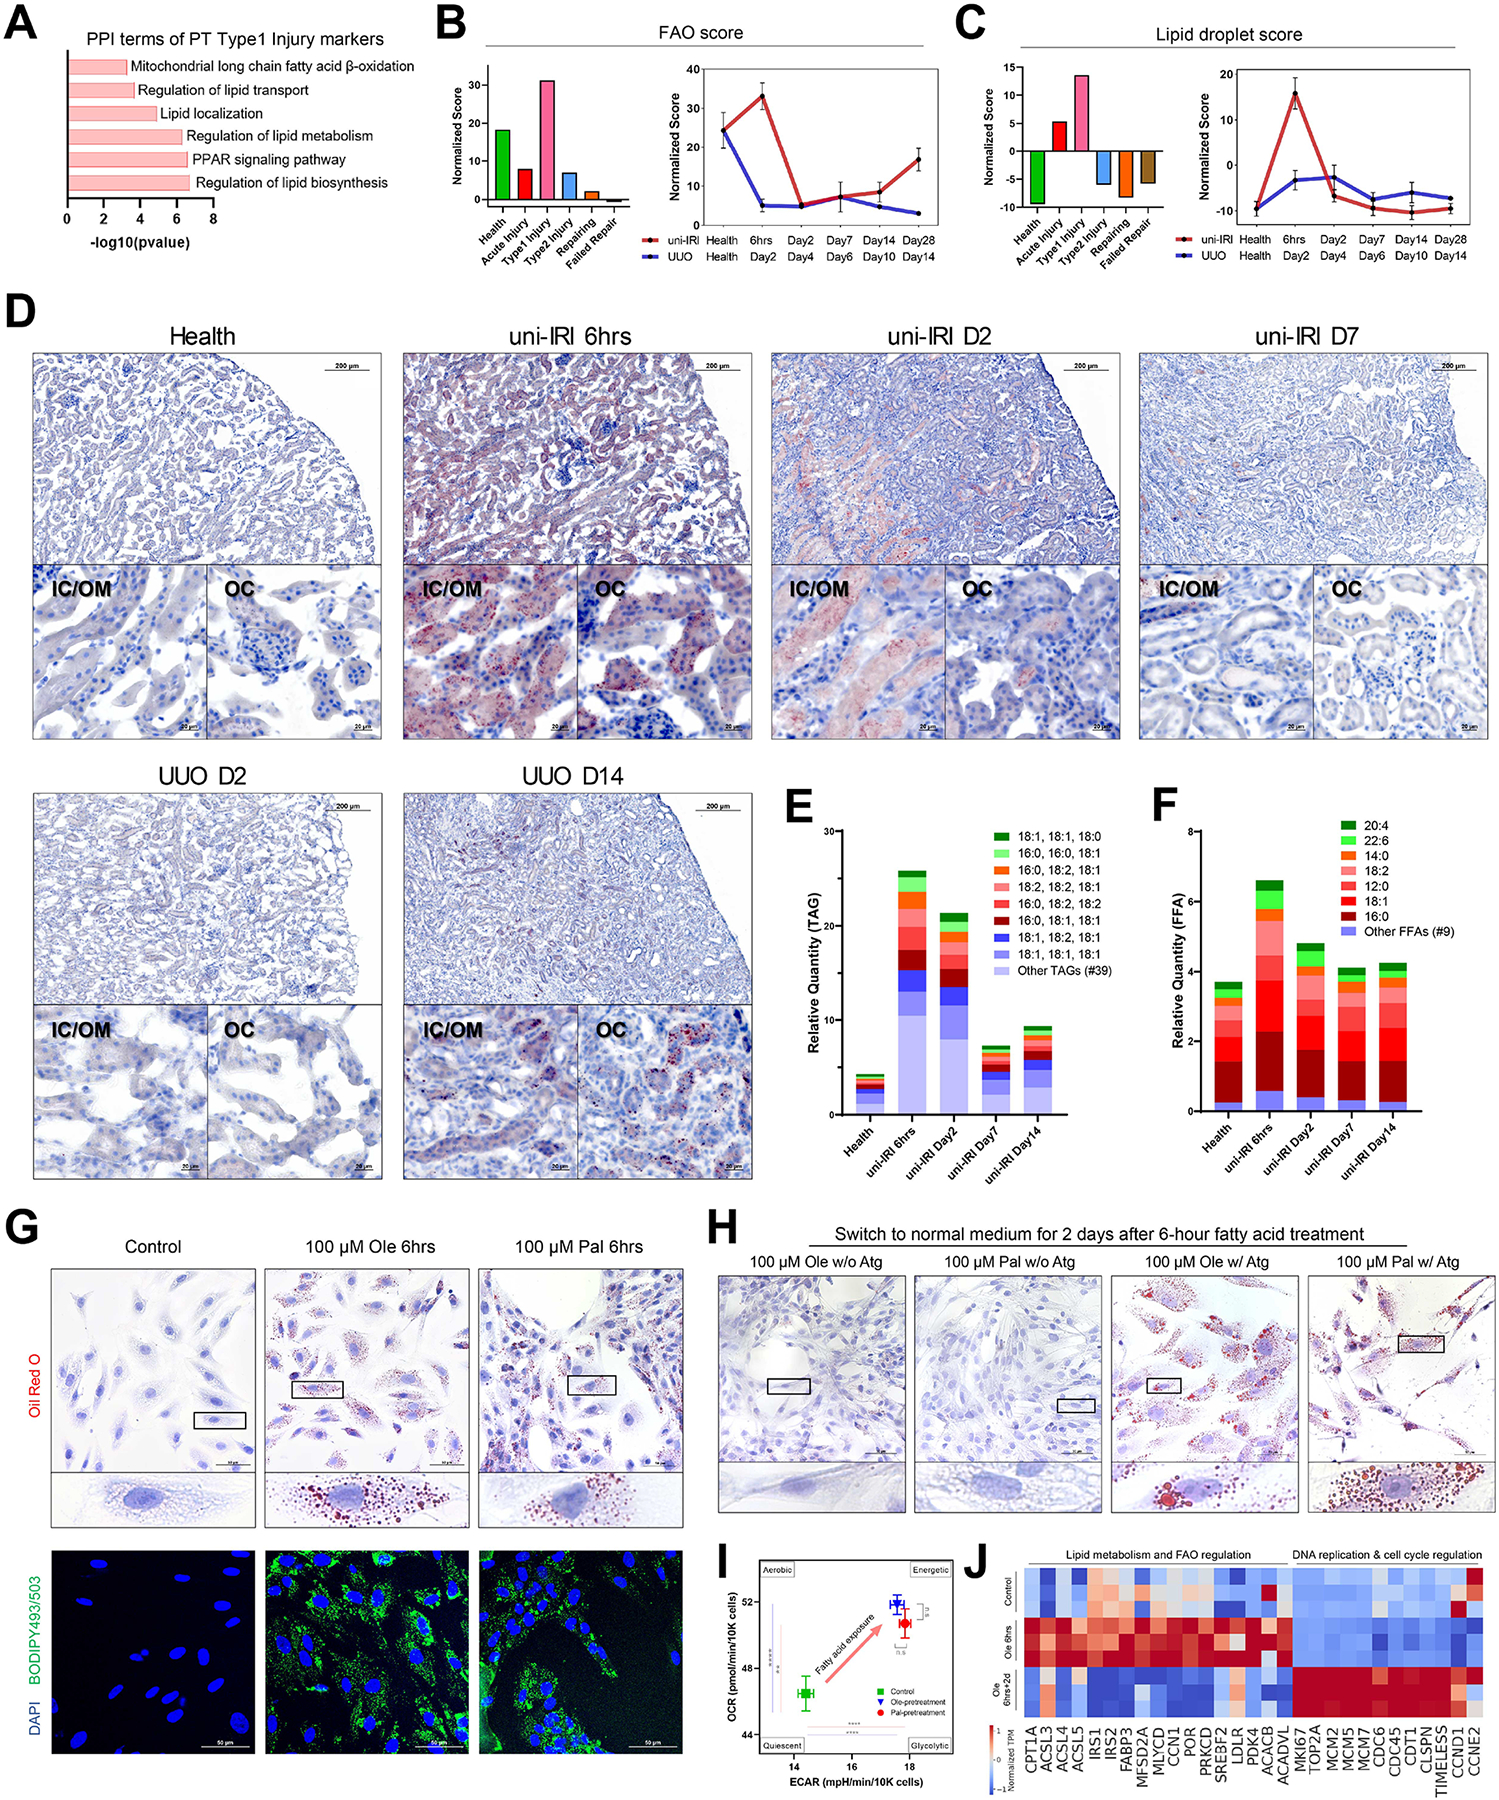
Figure 3. Dysregulated lipid metabolism in proximal tubule cells during fibrogenesis and activated fatty acid oxidation after short-term lipid deposition.

(A) Protein-protein interaction (PPI) enrichment analysis on upregulated differentially expressed genes of Type1 injured PT cells showing terms associated with lipid metabolism.
(B-C) Gene module activity scores of FAO (B) and lipid droplets (C) in different PT clusters (all time points) (left panels) and across the time courses of uni-IRI and UUO (right panels), where each dot indicates mean score of two samples of a group condition and data are shown as the mean ± SEM.
(D) Oil Red O staining on multiple group conditions identifying transient accumulation of lipids at uni-IRI 6hrs, clearance of lipids after uni-IRI D2 and lipid accumulation at late stages of UUO. Regions of inner cortex or outer medulla (IC/OM) and outer cortex (OC) are shown. Red color indicates lipids and blue indicates cell nucleus. See also Figure S3C.
(E) Relative quantity of triglyceride (TAG) species in mouse kidney tissues of different group conditions. The most abundant 8 TAG species are presented and the other species are combined and annotated as ‘Other TAGs’. See also Figure S3D.
(F) Relative quantity of free fatty acid (FFA) species in mouse kidney tissues of different group conditions. The most abundant 7 FFA species are presented and the other species are combined and annotated as ‘Other FFAs’. See also Figure S3D.
(G) Oil Red O staining (upper panels) and BODIPY493/503 staining (lower panels) on RPTECs after 6-hour treatment of 100 μM BSA-conjugated oleate (Ole) or palmitate (Pal) fatty acids. Scale bars: 50 μm. Zoom-in figures of a single cell are also presented for Oil Red O staining, which demonstrates accumulation of lipid droplets after treatment.
(H) Oil Red O staining on RPTECs which were exposed to culture medium without fatty acid supplements after 6-hour of 100 μM oleate or palmitate fatty acid treatment, with (w/) or without (w/o) Atglistatin (Atg) treatment. Scale bars: 50 μm. Zoom-in figures of a single cell are also presented.
(I) Energy map presenting an increased OCR and ECAR at the basal condition after 6-hour 100 μM oleate or palmitate fatty acid pretreatment on RPTECs. OCR and ECAR readouts are normalized by cell numbers. Data are shown as the mean ± SEM. The four energy states were annotated as previously described. **p < 0.01, ****p < 0.0001 and n.s (not significant) by Student’s t test.
(J) Heat map showing expression of genes involved in lipid metabolism & FAO regulation and DNA replication & cell cycle regulation in RPTECs with control and 6-hour 100 μM oleic acid (Ole 6hrs) treatments and harvested at 2 days after the 6-hour treatment (Ole 6hrs+2d). Each group has three biological replicates. Transcript per million (TPM) is normalized for visualization.
