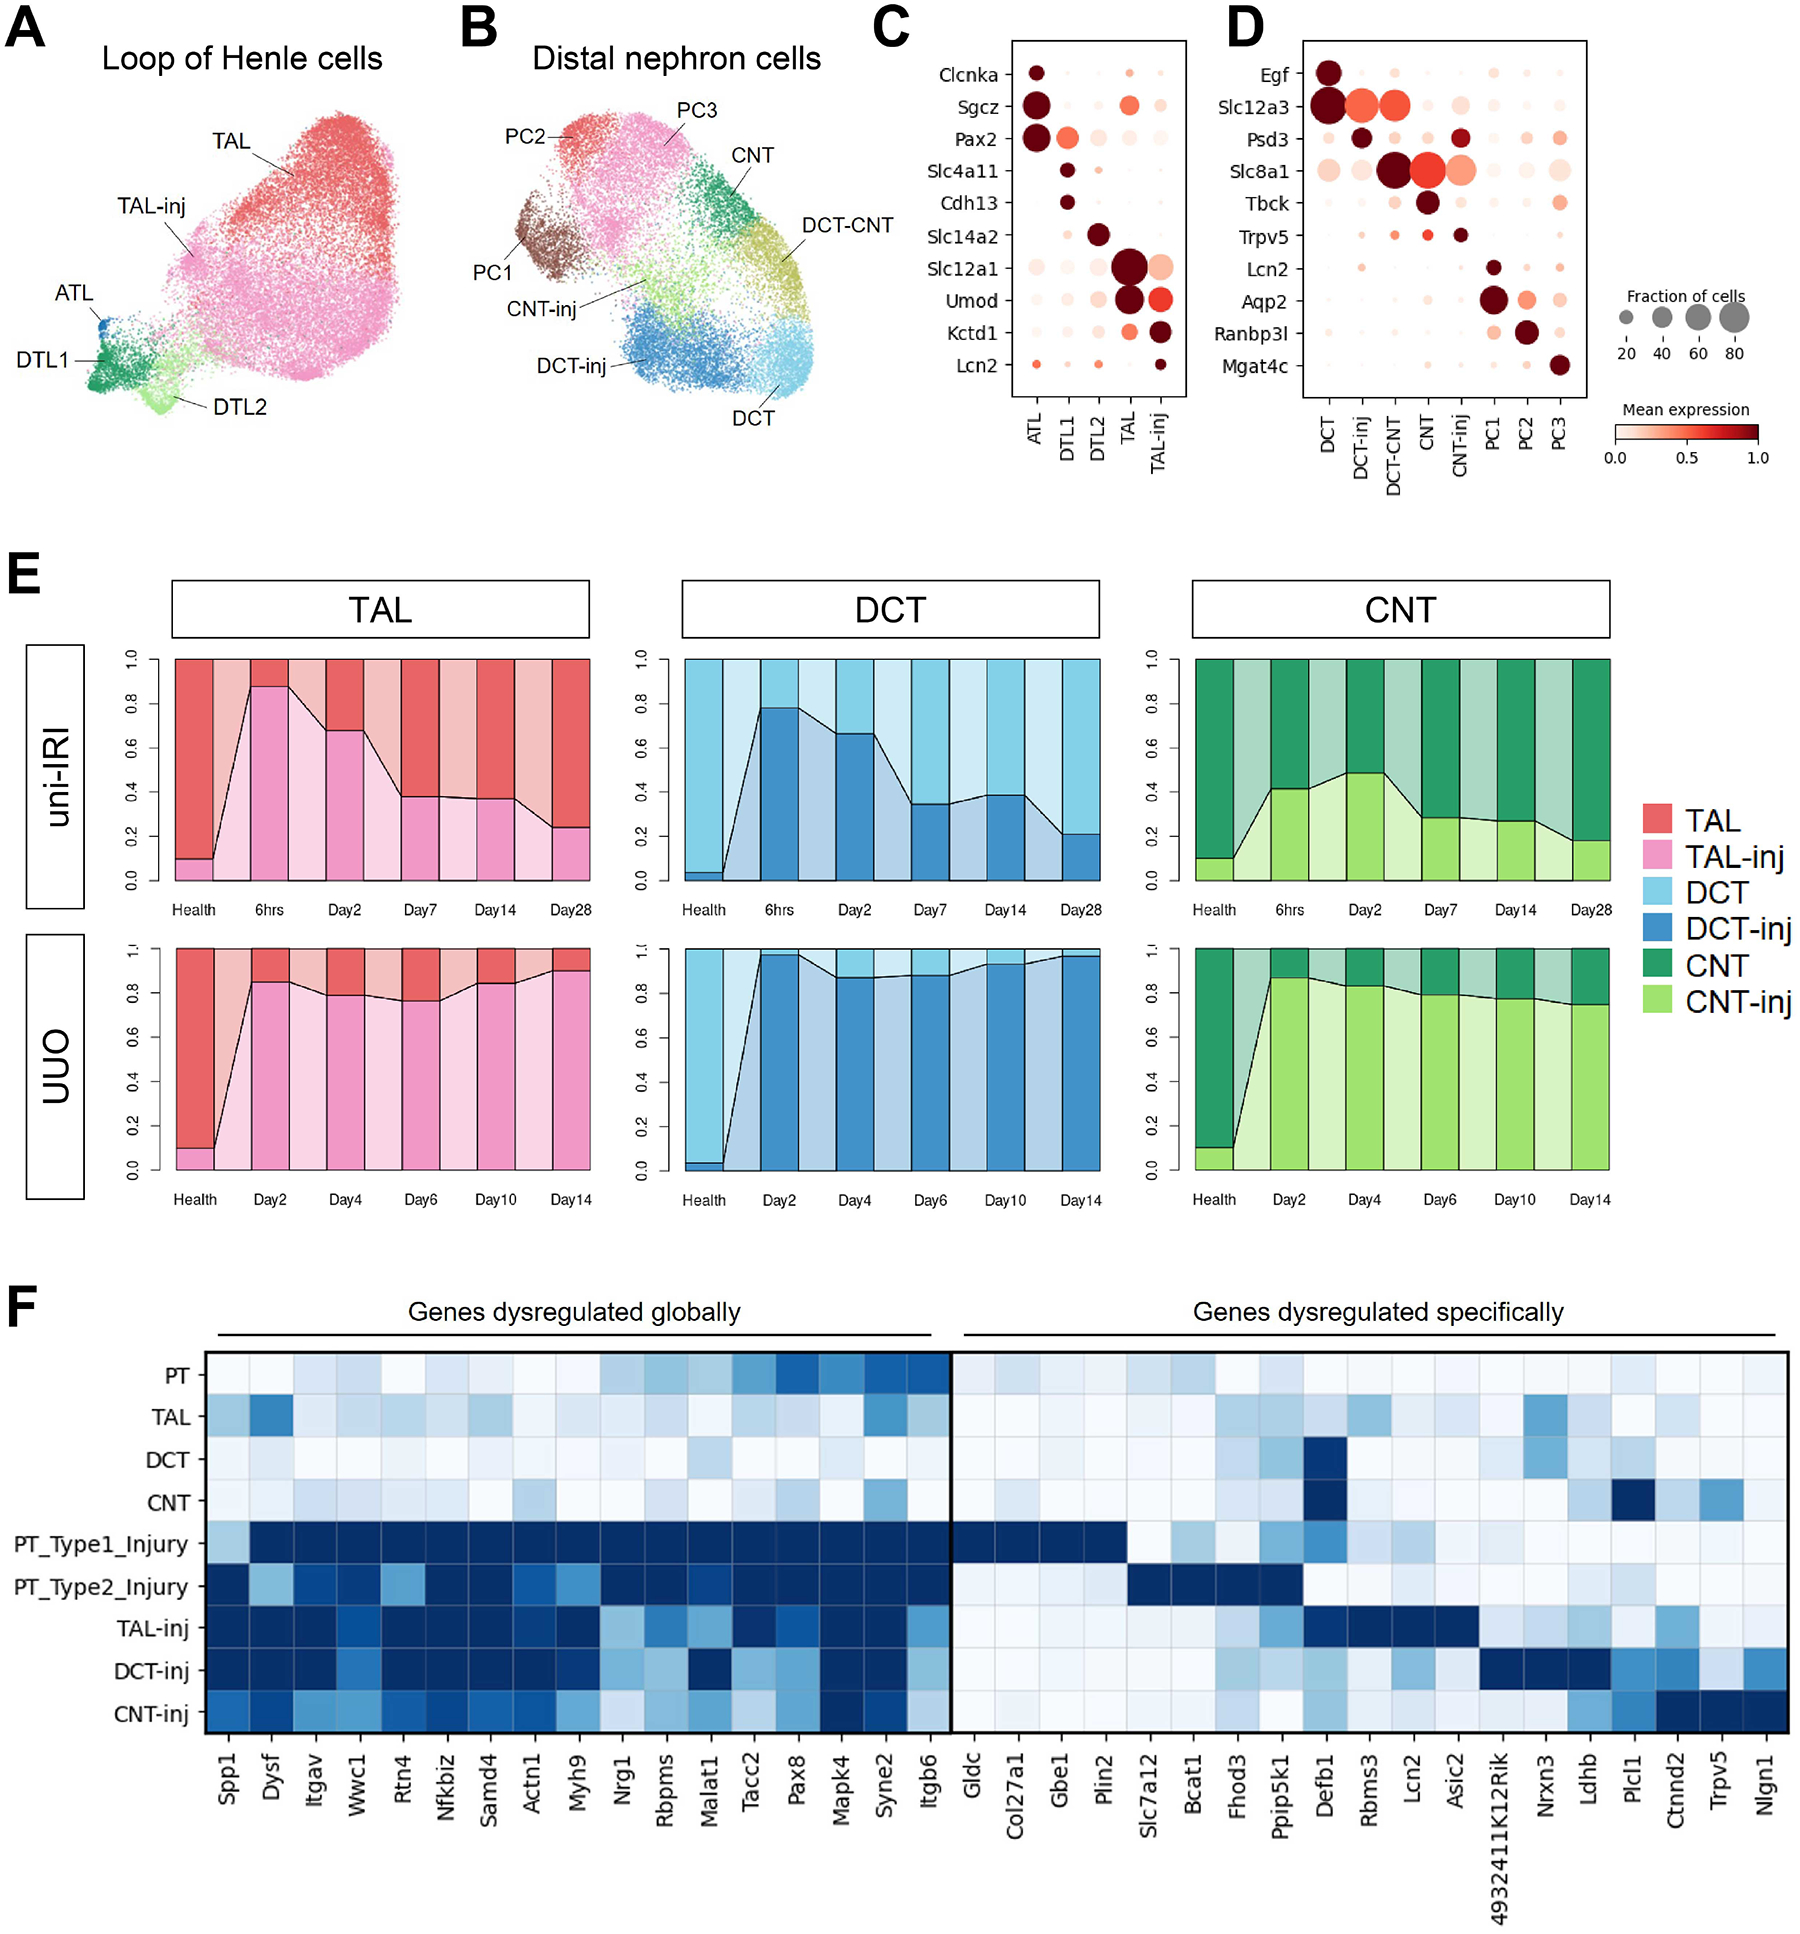
Figure 6. Shared and unique injury responses of renal tubular epithelial cells.

(A-B) UMAP plots of cells of LoH (A) and DCT, CNT and PC (B) in subclustering analysis. Abbreviations of cell types have been described in Figure 1D.
(C-D) Dot plots showing expression of genes specific to cell clusters identified in Figure 6A–B. Visualization was performed on dataset combining both uni-IRI and UUO subsets.
(E) Connected bar plots displaying the proportional abundance of healthy and injured TECs (including TAL, DCT and CNT) in each group condition, which identifies a shared injury response of TECs in an insult-dependent manner.
(F) Heat maps presenting expression of genes that are either co-varied across all injured TECs or dysregulated in a cell-type-specific manner compared to the healthy state of each TEC.
