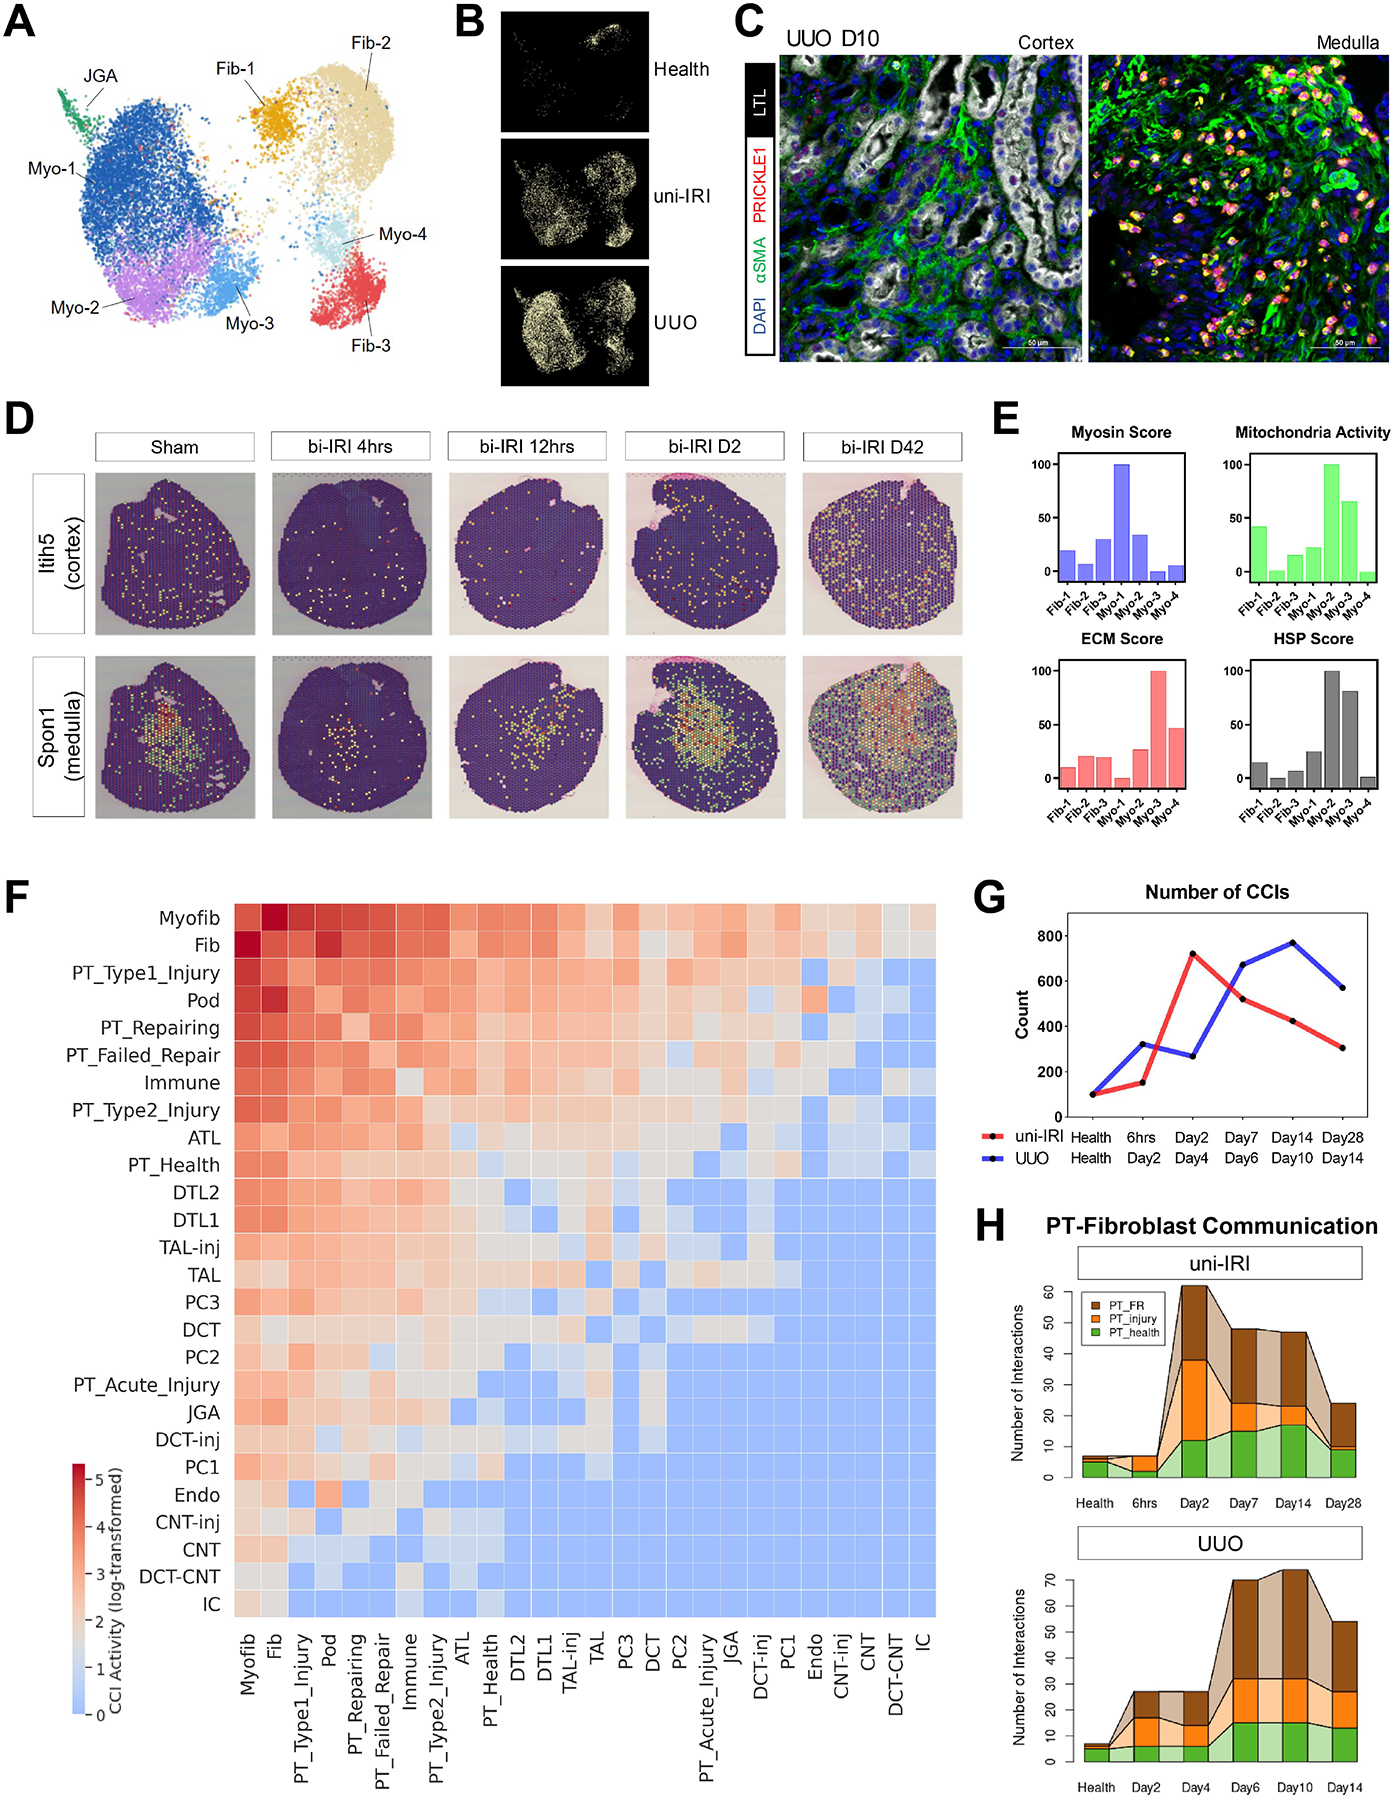
Figure 7. Heterogeneity of kidney stromal cells and cell-cell communications in kidney fibrogenesis.

(A) UMAP plot of all stromal subtypes identified in subclustering analysis. Fib, fibroblast; Myo, myofibroblast; JGA, juxtaglomerular apparatus. See also Figure S7A.
(B) Condition map showing unique distribution of stromal cells in different experimental groups.
(C) Immunofluorescence staining of DAPI (blue), α-SMA (i.e., ACTA2) (green), PRICKLE1 (red) and LTL (white) on a tissue section collected from UUO D10 identifying PRICKLE1 expression on nuclear membranes of myofibroblasts in kidney medulla. Scale bars: 50 μm.
(D) Expression of two region-specific genes in a spatial transcriptomics dataset on female bi-IRI kidneys. Each spot of a tissue section is colored by gene expression. See also Figure S7D.
(E) Gene module activities on myosin, mitochondrial respiratory chain reactions, extracellular matrix (ECM) and heat-shock proteins (HSP) in each stromal subtype. Gene module scores are shown as means. For the convenience of data visualization, normalization is performed by adjusting the lowest score of each module as 0.
(F) Heat map showing the number of significant ligand-receptor pairs in cell-cell interaction (CCIs) analysis, predicted by CellPhoneDB, between major kidney cell types. Log-transformed data are shown. Populations with similar transcriptomics are combined for the convenience of data visualization.
(G) Numbers of significant CCIs identified by CellPhoneDB across the time courses of uni-IRI and UUO.
(H) Connected bar plots displaying the number of significant CCIs between (myo)fibroblasts and PT cells in each group condition. Fibroblast and myofibroblast are combined to increase robustness of data analysis. PT_injury combines PT-AcInj, PT-R and Type1/2 injured PT cells.
